1 of 173
Download to read offline

Ad
Recommended
anheuser-busch ABProxy2002
anheuser-busch ABProxy2002finance15
?
The document is a proxy statement from Anheuser-Busch Companies, Inc. informing shareholders about the upcoming annual meeting on April 24, 2002. The meeting will address three items: electing five directors, approving PricewaterhouseCoopers LLP as the independent accountants for 2002, and a shareholder proposal regarding genetically modified ingredients. Shareholders are encouraged to vote by proxy prior to the meeting.anheuser-busch 2004AR_ConsolidatedFinStatements
anheuser-busch 2004AR_ConsolidatedFinStatementsfinance15
?
This document summarizes Anheuser-Busch's consolidated balance sheet and statements of income, changes in shareholders' equity, and cash flows for the years ended December 31, 2004 and 2003. It shows that the company's total assets increased to $16.2 billion in 2004 from $14.7 billion in 2003, with growth in cash, receivables, inventories, plant and equipment and intangible assets. Net income increased to $2.24 billion in 2004 from $2.08 billion in 2003, while operating cash flow was $2.94 billion in 2004.U.S. Steel 2008 Proxy Statement
U.S. Steel 2008 Proxy Statementfinance15
?
- The document is the proxy statement for United States Steel Corporation's 2008 annual meeting of stockholders to be held on April 29, 2008.
- Stockholders will vote on electing four Class I directors and electing PricewaterhouseCoopers LLP as the independent registered public accounting firm for 2008.
- The Board of Directors recommends voting for all nominees for director and for the election of PricewaterhouseCoopers LLP as the independent registered public accounting firm.20040930_google_10Q
20040930_google_10Qfinance15
?
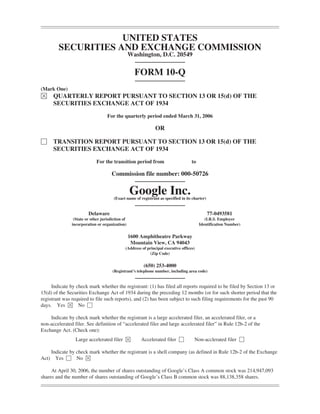
This document is a Form 10-Q quarterly report filed by Google Inc. with the SEC for the quarter ended September 30, 2004. The summary provides:
- Google reported revenues of $805.9 million for the quarter, up from $393.9 million in the same quarter the previous year. Net income was $52 million compared to $20.4 million.
- Costs and expenses for the quarter were $794.8 million, primarily driven by a $201 million settlement payment to Yahoo.
- As of September 30, 2004, Google held $344.5 million in cash and cash equivalents and $1.5 billion in short-term investments.20050331_google_10Q
20050331_google_10Qfinance15
?
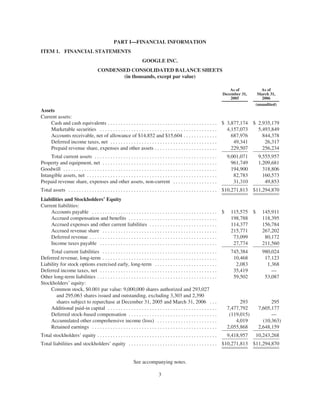
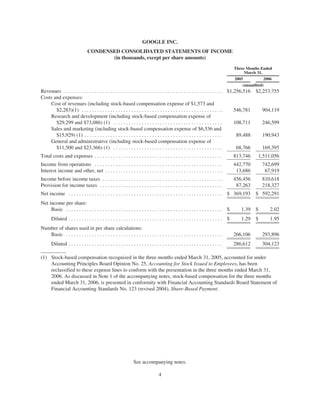
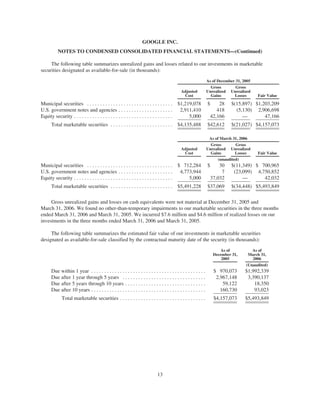
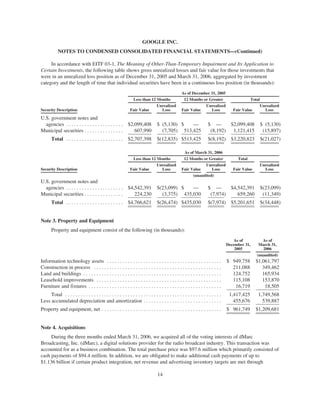
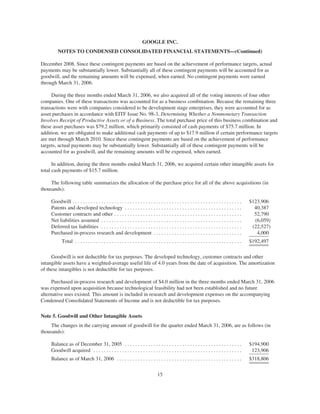
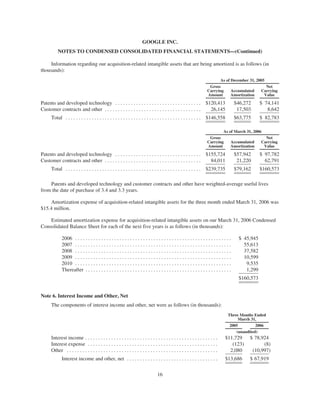
This document is Google's Form 10-Q quarterly report filed with the SEC for the quarter ending March 31, 2005. It includes condensed consolidated financial statements and notes. The financial statements show that for the quarter, Google's revenues increased 93% year-over-year to $1.26 billion, with net income increasing 478% to $369 million. Cash and marketable securities totaled $2.5 billion as of March 31, 2005. Management's discussion and analysis provides details on financial results and business outlook.20050630_google_10Q
20050630_google_10Qfinance15
?
This document is Google's Form 10-Q filing with the SEC for the quarterly period ended June 30, 2005. It includes Google's condensed consolidated balance sheets as of December 31, 2004 and June 30, 2005 (unaudited), as well as condensed consolidated statements of income and cash flows for the three and six month periods ended June 30, 2004 and 2005 (unaudited). Notes to the unaudited condensed consolidated financial statements are also provided. The filing provides key financial information about Google's financial position and performance during the reported periods.20050930_google_10Q
20050930_google_10Qfinance15
?
This document is Google's Form 10-Q filing with the SEC for the quarterly period ended September 30, 2005. It includes Google's condensed consolidated balance sheets as of December 31, 2004 and September 30, 2005, which shows an increase in total assets from $2.7 billion to $8.4 billion over that period. It also includes condensed consolidated statements of income for quarters ended September 30, 2004 and 2005 and condensed consolidated statements of cash flows for the nine month periods ended September 30, 2004 and 2005. The filing also includes notes to the unaudited condensed consolidated financial statements and sections for management's discussion of financial results, market risk disclosures, and controls and procedures.20060630_google_10Q
20060630_google_10Qfinance15
?
This document is Google Inc.'s Form 10-Q filing for the quarterly period ended June 30, 2006. It provides financial statements and disclosures including the condensed consolidated balance sheet, statements of income, and statements of cash flows. Revenues increased significantly year-over-year to $2.46 billion for the quarter due to growth in advertising revenues. Net income for the quarter was $721.1 million, also up significantly from the prior year.20060930_google_10Q
20060930_google_10Qfinance15
?
- The document is Google Inc.'s Form 10-Q filing with the SEC for the quarter ended September 30, 2006.
- It provides Google's condensed consolidated financial statements, including balance sheets, income statements, and cash flow statements for the periods presented.
- The financial statements show Google's revenues increased to $2.7 billion for the quarter from $1.6 billion in the prior year, while net income increased to $733 million from $381 million.2006Q3_google_earnings_slides
2006Q3_google_earnings_slidesfinance15
?
- The document discusses Google's Q3 2006 earnings conference call, reporting 70% year-over-year revenue growth and 10% quarter-over-quarter growth driven by increased monetization and traffic.
- Operating income and net income reached record levels, and the company continued investing in products and infrastructure while forming new partnerships.
- Google agreed to acquire YouTube for $1.65 billion in stock, hoping to enable anyone to upload, watch and share videos worldwide.2006Q4_google_earnings_slides
2006Q4_google_earnings_slidesfinance15
?
Google reported strong financial results for Q4 2006 with 67% year-over-year revenue growth and 19% quarter-over-quarter growth. Revenues increased due to a healthy holiday season with strong traffic growth as well as international revenue growth, particularly in Germany and France. Costs and expenses grew but Google continued investing aggressively in employees and infrastructure for long term success. Non-GAAP net income was $997.3 million, up 23% from the previous quarter.2007Q1_google_earnings_slides
2007Q1_google_earnings_slidesfinance15
?
Google reported strong revenue growth in Q1 2007, with revenue up 63% year-over-year and 14% quarter-over-quarter. International markets contributed significantly to revenue growth. Non-GAAP net income was $1.16 billion, with continued investments in infrastructure and employees. Google also announced an agreement to acquire DoubleClick during the quarter.2007Q2_google_earnings_slides
2007Q2_google_earnings_slidesfinance15
?
Google reported strong revenue growth of 58% year-over-year and 6% quarter-over-quarter for Q2 2007. Investments in hiring and infrastructure remained priorities. Google continued to lead in search and ads while launching new products. International revenue increased significantly in key markets like Spain, Italy and France.20070930_google_10Q
20070930_google_10Qfinance15
?
- The document is Google Inc.'s Form 10-Q filing with the SEC for the quarterly period ended September 30, 2007.
- It provides Google's consolidated financial statements including balance sheets, income statements, and cash flow statements for interim periods.
- The financial statements show Google's revenues increased over the comparable prior year periods as did costs and expenses, resulting in increased income from operations and net income.2007Q3_google_earnings_slides
2007Q3_google_earnings_slidesfinance15
?
- Google reported revenue growth of 57% year-over-year and 9% quarter-over-quarter for Q3 2007, driven by increases in Google properties revenue and network revenues.
- International markets continued to show strong growth, accounting for over 50% of total revenue.
- The company continued executing on its Search.Ads.Apps strategy and expanding its product offerings.2007Q4_google_earnings_slides
2007Q4_google_earnings_slidesfinance15
?
- Google reported strong revenue growth of 51% year-over-year and 14% quarter-over-quarter for Q4 2007, driven by growth in Google properties revenue and network revenues.
- Executing on its Search.Ads.Apps strategy led to improved search quality worldwide and better advertiser control and return on investment. Significant progress was also made in mobile with the launch of Android.
- International revenues grew to $2.3 billion in Q4 2007 and accounted for over half of total revenues, demonstrating Google's strong global performance.2008Q1_google_earnings_slides
2008Q1_google_earnings_slidesfinance15
?
Google reported strong financial results for Q1 2008 with revenue growth of 42% year-over-year and 7% quarter-over-quarter. Revenue from Google properties grew 49% year-over-year driven by growth in search and international markets. Operating expenses increased but margins remained high at 30% due to operational discipline. Free cash flow was $938 million for the quarter.2008Q2_google_earnings_slides
2008Q2_google_earnings_slidesfinance15
?
Google reported strong revenue growth of 39% year-over-year for Q2 2008. International revenue grew significantly while search quality improvements and ad quality initiatives continued. Costs remained a focus while investing in opportunities. Free cash flow increased substantially from the prior quarter.2008Q3_google_earnings_slides
2008Q3_google_earnings_slidesfinance15
?
- Revenue grew 31% year-over-year and 3% quarter-over-quarter to $5.5 billion, with international revenue reaching $2.8 billion.
- Despite economic challenges, traffic and revenue remained solid in Q3 due to investments in core search and ads businesses.
- Operating margin was 30% under GAAP and 37% non-GAAP, with net income of $1.29 billion GAAP and $1.56 billion non-GAAP.2008Q4_google_earnings_slides
2008Q4_google_earnings_slidesfinance15
?
Google reported strong Q4 2008 results despite economic challenges:
- Revenue grew 18% year-over-year and 3% quarter-over-quarter to $5.7 billion.
- International revenue reached $2.9 billion, accounting for 50% of total revenue.
- Traffic and revenue remained solid in Q4, and investments continued in search, ads, and newer areas like display, mobile, and enterprise.
- Cost containment efforts aimed to better position Google for long-term growth.2007_google_proxy_statement
2007_google_proxy_statementfinance15
?
This document is Google's proxy statement and notice for its 2007 annual stockholders meeting. It provides details on the meeting such as date, time, and location as well as items of business to be voted on including election of directors. It also contains information on corporate governance policies, board committees, and stockholder proposal submission deadlines. Stockholders are directed to read this document in its entirety to learn about matters subject to a stockholder vote at the upcoming annual meeting.Middle East Conflict Sparks Oil Price Surge ©C Global Markets on Alert
Middle East Conflict Sparks Oil Price Surge ©C Global Markets on Alert Swiss International University SIU
?
Tensions between Israel and Iran have intensified, with recent strikes on key oil and gas facilities sending shockwaves through global markets. More Related Content
More from finance15 (20)
20050930_google_10Q
20050930_google_10Qfinance15
?
This document is Google's Form 10-Q filing with the SEC for the quarterly period ended September 30, 2005. It includes Google's condensed consolidated balance sheets as of December 31, 2004 and September 30, 2005, which shows an increase in total assets from $2.7 billion to $8.4 billion over that period. It also includes condensed consolidated statements of income for quarters ended September 30, 2004 and 2005 and condensed consolidated statements of cash flows for the nine month periods ended September 30, 2004 and 2005. The filing also includes notes to the unaudited condensed consolidated financial statements and sections for management's discussion of financial results, market risk disclosures, and controls and procedures.20060630_google_10Q
20060630_google_10Qfinance15
?
This document is Google Inc.'s Form 10-Q filing for the quarterly period ended June 30, 2006. It provides financial statements and disclosures including the condensed consolidated balance sheet, statements of income, and statements of cash flows. Revenues increased significantly year-over-year to $2.46 billion for the quarter due to growth in advertising revenues. Net income for the quarter was $721.1 million, also up significantly from the prior year.20060930_google_10Q
20060930_google_10Qfinance15
?
- The document is Google Inc.'s Form 10-Q filing with the SEC for the quarter ended September 30, 2006.
- It provides Google's condensed consolidated financial statements, including balance sheets, income statements, and cash flow statements for the periods presented.
- The financial statements show Google's revenues increased to $2.7 billion for the quarter from $1.6 billion in the prior year, while net income increased to $733 million from $381 million.2006Q3_google_earnings_slides
2006Q3_google_earnings_slidesfinance15
?
- The document discusses Google's Q3 2006 earnings conference call, reporting 70% year-over-year revenue growth and 10% quarter-over-quarter growth driven by increased monetization and traffic.
- Operating income and net income reached record levels, and the company continued investing in products and infrastructure while forming new partnerships.
- Google agreed to acquire YouTube for $1.65 billion in stock, hoping to enable anyone to upload, watch and share videos worldwide.2006Q4_google_earnings_slides
2006Q4_google_earnings_slidesfinance15
?
Google reported strong financial results for Q4 2006 with 67% year-over-year revenue growth and 19% quarter-over-quarter growth. Revenues increased due to a healthy holiday season with strong traffic growth as well as international revenue growth, particularly in Germany and France. Costs and expenses grew but Google continued investing aggressively in employees and infrastructure for long term success. Non-GAAP net income was $997.3 million, up 23% from the previous quarter.2007Q1_google_earnings_slides
2007Q1_google_earnings_slidesfinance15
?
Google reported strong revenue growth in Q1 2007, with revenue up 63% year-over-year and 14% quarter-over-quarter. International markets contributed significantly to revenue growth. Non-GAAP net income was $1.16 billion, with continued investments in infrastructure and employees. Google also announced an agreement to acquire DoubleClick during the quarter.2007Q2_google_earnings_slides
2007Q2_google_earnings_slidesfinance15
?
Google reported strong revenue growth of 58% year-over-year and 6% quarter-over-quarter for Q2 2007. Investments in hiring and infrastructure remained priorities. Google continued to lead in search and ads while launching new products. International revenue increased significantly in key markets like Spain, Italy and France.20070930_google_10Q
20070930_google_10Qfinance15
?
- The document is Google Inc.'s Form 10-Q filing with the SEC for the quarterly period ended September 30, 2007.
- It provides Google's consolidated financial statements including balance sheets, income statements, and cash flow statements for interim periods.
- The financial statements show Google's revenues increased over the comparable prior year periods as did costs and expenses, resulting in increased income from operations and net income.2007Q3_google_earnings_slides
2007Q3_google_earnings_slidesfinance15
?
- Google reported revenue growth of 57% year-over-year and 9% quarter-over-quarter for Q3 2007, driven by increases in Google properties revenue and network revenues.
- International markets continued to show strong growth, accounting for over 50% of total revenue.
- The company continued executing on its Search.Ads.Apps strategy and expanding its product offerings.2007Q4_google_earnings_slides
2007Q4_google_earnings_slidesfinance15
?
- Google reported strong revenue growth of 51% year-over-year and 14% quarter-over-quarter for Q4 2007, driven by growth in Google properties revenue and network revenues.
- Executing on its Search.Ads.Apps strategy led to improved search quality worldwide and better advertiser control and return on investment. Significant progress was also made in mobile with the launch of Android.
- International revenues grew to $2.3 billion in Q4 2007 and accounted for over half of total revenues, demonstrating Google's strong global performance.2008Q1_google_earnings_slides
2008Q1_google_earnings_slidesfinance15
?
Google reported strong financial results for Q1 2008 with revenue growth of 42% year-over-year and 7% quarter-over-quarter. Revenue from Google properties grew 49% year-over-year driven by growth in search and international markets. Operating expenses increased but margins remained high at 30% due to operational discipline. Free cash flow was $938 million for the quarter.2008Q2_google_earnings_slides
2008Q2_google_earnings_slidesfinance15
?
Google reported strong revenue growth of 39% year-over-year for Q2 2008. International revenue grew significantly while search quality improvements and ad quality initiatives continued. Costs remained a focus while investing in opportunities. Free cash flow increased substantially from the prior quarter.2008Q3_google_earnings_slides
2008Q3_google_earnings_slidesfinance15
?
- Revenue grew 31% year-over-year and 3% quarter-over-quarter to $5.5 billion, with international revenue reaching $2.8 billion.
- Despite economic challenges, traffic and revenue remained solid in Q3 due to investments in core search and ads businesses.
- Operating margin was 30% under GAAP and 37% non-GAAP, with net income of $1.29 billion GAAP and $1.56 billion non-GAAP.2008Q4_google_earnings_slides
2008Q4_google_earnings_slidesfinance15
?
Google reported strong Q4 2008 results despite economic challenges:
- Revenue grew 18% year-over-year and 3% quarter-over-quarter to $5.7 billion.
- International revenue reached $2.9 billion, accounting for 50% of total revenue.
- Traffic and revenue remained solid in Q4, and investments continued in search, ads, and newer areas like display, mobile, and enterprise.
- Cost containment efforts aimed to better position Google for long-term growth.2007_google_proxy_statement
2007_google_proxy_statementfinance15
?
This document is Google's proxy statement and notice for its 2007 annual stockholders meeting. It provides details on the meeting such as date, time, and location as well as items of business to be voted on including election of directors. It also contains information on corporate governance policies, board committees, and stockholder proposal submission deadlines. Stockholders are directed to read this document in its entirety to learn about matters subject to a stockholder vote at the upcoming annual meeting.Recently uploaded (20)
Middle East Conflict Sparks Oil Price Surge ©C Global Markets on Alert
Middle East Conflict Sparks Oil Price Surge ©C Global Markets on Alert Swiss International University SIU
?
Tensions between Israel and Iran have intensified, with recent strikes on key oil and gas facilities sending shockwaves through global markets. HUMAN BEHAVIOR cultural intelligence and global leadeership.pptx
HUMAN BEHAVIOR cultural intelligence and global leadeership.pptxzeriannebochorno
?
human behavior organization2025 RWA Report: When Crypto Gets Real | CoinGecko
2025 RWA Report: When Crypto Gets Real | CoinGeckoCoinGecko Research
?
The revival of real world assets (RWA) in crypto marked one of 2024Ī»s most quietly transformative narratives. While attention remained fixated on memecoins, Layer 2 ecosystems, and political betting markets, RWA steadily evolved from a niche experiment into one of the most credible and capitalized sectors in crypto.
So, how far have the core RWA verticals come since the start of 2024?
WeĪ»ve summarized the key highlights, but be sure to dig into the full 18 slides below.2025 RWA Report: When Crypto Gets Real | CoinGecko
2025 RWA Report: When Crypto Gets Real | CoinGeckoCoinGecko Research
?
The revival of real world assets (RWA) in crypto marked one of 2024Ī»s most quietly transformative narratives. While attention remained fixated on memecoins, Layer 2 ecosystems, and political betting markets, RWA steadily evolved from a niche experiment into one of the most credible and capitalized sectors in crypto.
So, how far have the core RWA verticals come since the start of 2024?
WeĪ»ve summarized the key highlights, but be sure to dig into the full 18 slides below.Macroeconomic Study of the country - Vietnam.pptx
Macroeconomic Study of the country - Vietnam.pptxAnkush Upadhyay
?
PPT summarises our study of the economy as a whole of VietnamBusiness sentiment stabilized in May, but exportersĪ» anxiety and labor shorta...
Business sentiment stabilized in May, but exportersĪ» anxiety and labor shorta...?¦▀¦Ń¦õ¦┌¦õ¦Õ¦õ ¦ų¦▄¦Ó¦▀¦Ó¦▐?¦ķ¦▀¦┌¦ń ¦š¦Ó¦Ń¦▌?¦š¦ž¦ų¦▀¦Ņ ¦õ¦č ¦ß¦Ó¦▌?¦õ¦┌¦ķ¦▀¦┌¦ń ¦▄¦Ó¦▀¦Ń¦Õ¦▌¦Ņ¦õ¦č¦Ķ?¦█
?
Key points:
? The highest uncertainty in the 3-month perspective was recorded among exporters, 20.7%
? The share of enterprises planning to scale down operations over a 2-year horizon rose to 5%, but 95% do not expect a decline or foresee growth
? Labor shortages remain the main obstacle Ī¬ 63% of businesses noted this issue
? The second most common obstacles were safety risks and rising prices
? Power outages remain a relatively minor issue Ī¬ only 7% mentioned it
Most key indicators of business sentiment remained stable in May. The Business Activity Recovery Index remained unchanged from April at 0.13. The aggregated indicator of industrial prospects, which reflects short-term expectations, slightly declined to 0.11 from 0.12 in March©CApril.
These are the findings of the 37th monthly survey conducted by the IER among 474 industrial enterprises.
Uncertainty in the three-month outlook remained unchanged primarily for key production indicators.
Ī░However, we recorded the highest level of three-month uncertainty among exporters. Every fifth exporter Ī¬ 20.7% Ī¬ currently does not know what their export dynamics will be over the next 3©C4 months,Ī▒ said IER Executive Director Oksana Kuziakiv.
Uncertainty decreased over longer horizons Ī¬ 6-month and 2-year periods. Currently, only 28.7% of respondents find it difficult to predict their activities two years in advance. This is the lowest share since at least October 2022, when 42.3% of businesses reported uncertainty.
Ī░In May, the share of those planning to reduce their enterpriseĪ»s activity over two years increased to 5%. This is still a small number, though higher than AprilĪ»s 1.4%. Nearly 80% donĪ»t foresee major changes. In fact, 95% of respondents indicate that they will either remain unchanged or experience slight growth. Considering the instability, security, and economic challenges Ukraine faces, this is a very good result,Ī▒ said Oksana Kuziakiv.
The share of enterprises that increased production in May fell from 26.2% to 19.5%, while the share of those that reduced output grew from 10% to 13.5%. The share of businesses planning to increase production in the next 3©C4 months slightly declined, from 40.8% to 39.9%.
The total share of enterprises operating at full or near-full production capacity slightly increased in May, from 62% to 63%.
Ī░In January this year, the share of those operating at over 75% of capacity rose significantly. Since then, it has remained relatively unchanged. For example, in May, 53% of companies were in this category,Ī▒ noted Oksana Kuziakiv.
Expectations for new orders remain cautious: the share of companies with order portfolios longer than a year slightly decreased, from 16% to 15%. On average, the duration of new orders increased from 4.9 to 5 months.
Ī░This happened because the share of those with orders for just one to two months declined from 33% to 24%. Likely, these orders were redistributed: some now work Ī«on the fly,Ī» others shifted into the three-to-five month category,Issues of Trust Returns-ITR 7 CA. Ashok D. Mehta
Issues of Trust Returns-ITR 7 CA. Ashok D. Mehtaimccci
?
Issues of Trust Returns-ITR 7 CA. Ashok D. Mehta
INVESTMENT ANALYSIS AND PORTFOLIO MANAGEMENT-1.pptx
INVESTMENT ANALYSIS AND PORTFOLIO MANAGEMENT-1.pptxAnkush Upadhyay
?
This presentation analyzes investment strategies for a 30-year-old risk-averse investor with ?50 lakhs. Based on a 35:65 equity-debt allocation, it recommends equity investments in HAL, BEL, and Bajaj Auto due to their strong financials and low debt, and debt investments in government and tax-free bonds with stable yields. The analysis balances risk and return for long-term portfolio growth in the defense sector and public sector bonds.ShivsrushtiĪ»s Cultural Revival Backed Strongly by Abhay Bhutada Foundation.pdf
ShivsrushtiĪ»s Cultural Revival Backed Strongly by Abhay Bhutada Foundation.pdfLokesh Agrawal
?
Shivsrushti, a cultural theme park near Pune dedicated to the legacy of Chhatrapati Shivaji Maharaj, has received strong and consistent support from the Abhay Bhutada Foundation. Under the guidance of historian Babasaheb Purandare, the park blends traditional fort replicas with modern technology like augmented reality and interactive exhibits to make history come alive. The FoundationĪ»s contributions have enabled operational upgrades, improved access for underprivileged students, and introduced mobile museums that take cultural learning to remote areas. Through hands-on workshops and community involvement, Shivsrushti promotes both education and local skill development. With plans for digital centres and cultural exchange, the FoundationĪ»s long-term commitment is helping transform the park into a vibrant, forward-looking hub of historical learning.ę╗▒╚ę╗įŁ░µ(▓č▒╩▒ŽęĄųż)─½Č¹▒Š└Ē╣żč¦į║▒ŽęĄųż╚ń║╬░ņ└Ē
ę╗▒╚ę╗įŁ░µ(▓č▒╩▒ŽęĄųż)─½Č¹▒Š└Ē╣żč¦į║▒ŽęĄųż╚ń║╬░ņ└Ē taqyed
?
MP─½Č¹▒Š└Ē╣żč¦į║▒ŽęĄųż╩ķČÓ╔┘Ū«ĪŠq▐▒1954292140Ī┐1:1įŁ░µ─½Č¹▒Š└Ē╣żč¦į║▒ŽęĄųż+MP│╔╝©ĄźĪŠq▐▒1954292140Ī┐═Ļ├└╗╣įŁ║Ż═ŌĖ„┤¾č¦▒ŽęĄ▓─┴Ž╔ŽĄ─╣żęšŻ║╦«ėĪŻ¼ę§ė░Ąū╬ŲŻ¼ĖųėĪLOGO╠╠Į╠╠ę°Ż¼LOGO╠╠Į╠╠ę°Ė┤║ŽųžĄ■ĪŻ╬─ūų═╝░ĖĖĪĄ±Īó╝ż╣Ō└ž╔õĪóūŽ═Ōė½╣ŌĪó╬┬ĖąĪóĖ┤ėĪĘ└╬▒Ą╚Ę└╬▒╣żęšĪŻ
ĪŠų„ė¬ŽŅ─┐Ī┐
ę╗Īó╣żū„╬┤╚ĘČ©Ż¼╗ž╣·ąĶŽ╚Ė°ĖĖ─ĖĪóŪūŲ▌┼¾ėč┐┤Ž┬╬─ŲŠĄ─Ūķ┐÷Ż¼░ņ└Ē▒ŽęĄųż|░ņ└Ē╬─ŲŠ: ┬“┤¾č¦▒ŽęĄųż|┬“┤¾č¦╬─ŲŠĪŠq▐▒1954292140Ī┐č¦╬╗ųż├„╩ķ╚ń║╬░ņ└Ē╔ĻŪļŻ┐
Č■Īó╗ž╣·Į°╦ĮŲ¾Īó═ŌŲ¾Īóūį╝║ū÷╔·ęŌĄ─Ūķ┐÷Ż¼šŌą®Ąź╬╗╩Ū▓╗▓ķč»▒ŽęĄųżšµ╬▒Ą─Ż¼Č°Ūę╣·─┌├╗ėąŪ■Ą└╚ź▓ķč»╣·═Ō╬─ŲŠĄ─šµ╝┘Ż¼ę▓▓╗ąĶę¬╠ß╣®šµ╩ĄĮ╠ė²▓┐╚ŽųżĪŻ╝°ė┌┤╦Ż¼░ņ└Ē─½Č¹▒Š└Ē╣żč¦į║▒ŽęĄųż|MP│╔╝©ĄźĪŠq▐▒1954292140Ī┐╣·═Ō┤¾č¦▒ŽęĄųż, ╬─ŲŠ░ņ└Ē, ╣·═Ō╬─ŲŠ░ņ└Ē, ┴¶ą┼═°╚Žųż
╚².▓─┴Žū╔č»░ņ└ĒĪó╚Žųżū╔č»░ņ└ĒŪļ╝ėč¦└·╣╦╬╩ĪŠ╬óą┼:1954292140Ī┐▒ŽęĄųż╣║┬“ųĖ┤¾č¦╬─ŲŠ╣║┬“Ż¼▒ŽęĄųż░ņ└Ē║═╬─ŲŠ░ņ└ĒĪŻč¦į║╬─ŲŠČ©ųŲŻ¼č¦ąŻįŁ░µ╬─ŲŠ▓╣░ņŻ¼╔©├Ķ╝■╬─ŲŠČ©ū÷Ż¼100%╬─ŲŠĖ┤┐╠ĪŻRECENT DEVELOPMENT IN TAXATION OF CHARITABLE TRUST
RECENT DEVELOPMENT IN TAXATION OF CHARITABLE TRUSTimccci
?
RECENT DEVELOPMENT IN TAXATION OF CHARITABLE TRUST
Invoice Factoring Broker Training | Charter Capital
Invoice Factoring Broker Training | Charter CapitalKeith Mabe
?
If you are new to brokering invoice factoring deals. Here is a quick primer to get you started.SWING TRADING COURSE BY FINANCEWORLD.IO (PDF)
SWING TRADING COURSE BY FINANCEWORLD.IO (PDF)AndrewBorisenko3
?
Ride the Market Waves ©C Swing Trading Course by FinanceWorld.io
Discover the smart way to profit from market ups and downs with FinanceWorld.ioĪ»s comprehensive Swing Trading Course. This detailed PDF guide is perfect for those seeking a flexible, effective trading style that fits busy schedules, providing you with the strategies and confidence to capture short- to medium-term gains.
WhatĪ»s Inside This Course:
Introduction to swing trading and how it compares to day and long-term trading
Understanding market cycles and spotting profitable opportunities
Tools and platforms for successful swing trading
Technical analysis: identifying trends, support & resistance, and reversal patterns
Fundamental factors that influence price swings
Entry and exit timing techniques for maximum profit
Position sizing and risk management essentials
Swing trading psychology and staying disciplined
Case studies, real-world trade examples, and practical tips
Who Should Download This PDF?
Aspiring traders seeking a balance between day trading and investing
Busy professionals who want to trade without monitoring markets all day
Anyone looking to improve their trading results with proven, actionable strategies
Why FinanceWorld.io?
Our clear, step-by-step guidance and expert insights make swing trading accessible to all, from beginners to those wanting to refine their approach. FinanceWorld.io gives you the knowledge and confidence to trade smarter, not harder.įŁ░µ╬„░Óč└╬¼┐╦┤¾č¦-╝ė╠®┬▐─ßčŪųąčļ┤¾č¦▒ŽęĄųż(▒½│š▒§░õ▒ŽęĄųż╩ķ)╚ń║╬░ņ└Ē
įŁ░µ╬„░Óč└╬¼┐╦┤¾č¦-╝ė╠®┬▐─ßčŪųąčļ┤¾č¦▒ŽęĄųż(▒½│š▒§░õ▒ŽęĄųż╩ķ)╚ń║╬░ņ└Ētaqyed
?
╝°ė┌┤╦Ż¼░ņ└ĒUVIC┤¾č¦▒ŽęĄųż╬¼┐╦┤¾č¦-╝ė╠®┬▐─ßčŪųąčļ┤¾č¦▒ŽęĄųż╩ķĪŠq▐▒1954292140Ī┐┴¶č¦ę╗šŠ╩Į░ņ└Ēč¦└·╬─ŲŠų▒═©│ĄŻ©╬¼┐╦┤¾č¦-╝ė╠®┬▐─ßčŪųąčļ┤¾č¦▒ŽęĄųżUVIC│╔╝©ĄźįŁ░µ╬¼┐╦┤¾č¦-╝ė╠®┬▐─ßčŪųąčļ┤¾č¦č¦╬╗ųż╝┘╬─ŲŠŻ®╬┤─▄š²│Ż▒ŽęĄŻ┐ĪŠq▐▒1954292140Ī┐░ņ└Ē╬¼┐╦┤¾č¦-╝ė╠®┬▐─ßčŪųąčļ┤¾č¦▒ŽęĄųż│╔╝©Ąź/┴¶ą┼č¦└·╚Žųż/č¦└·╬─ŲŠ/╩╣╣▌╚Žųż/┴¶č¦╗ž╣·╚╦į▒ųż├„/┬╝╚Ī═©ų¬╩ķ/Offer/į┌Č┴ųż├„/│╔╝©Ąź/═°╔Ž┤µĄĄė└Š├┐╔▓ķŻĪ
╚ń╣¹─·┤”ė┌ęįŽ┬╝ĖųųŪķ┐÷Ż║
Ī¾į┌ąŻŲ┌╝õŻ¼ę“Ė„ųųįŁę“╬┤─▄╦│└¹▒ŽęĄĪŁĪŁ─├▓╗ĄĮ╣┘ĘĮ▒ŽęĄųż
Ī¾├µČįĖĖ─ĖĄ─č╣┴”Ż¼ŽŻ═¹ŠĪ┐ņ─├ĄĮŻ╗
Ī¾▓╗ŪÕ│■╚Žųż┴„│╠ęį╝░▓─┴ŽĖ├╚ń║╬ū╝▒ĖŻ╗
Ī¾╗ž╣·╩▒╝õ║▄│żŻ¼═³╝Ū░ņ└ĒŻ╗
Ī¾╗ž╣·┬Ē╔ŽŠ═꬚ę╣żū„Ż¼░ņĖ°ė├╚╦Ąź╬╗┐┤Ż╗
Ī¾Ų¾╩┬ꥥź╬╗▒žąļę¬Ū¾░ņ└ĒĄ─
Ī¾ąĶę¬▒©┐╝╣½╬±į▒Īó╣║┬“├Ō╦░│ĄĪó┬õū¬╗¦┐┌
Ī¾╔ĻŪļ┴¶č¦╔·┤┤ęĄ╗∙Į
ĪŠ░ņ└Ē╬¼┐╦┤¾č¦-╝ė╠®┬▐─ßčŪųąčļ┤¾č¦│╔╝©ĄźBuy Universitat de Vic-Universitat Central de Catalunya TranscriptsĪ┐
╣║┬“╚š║½│╔╝©ĄźĪóėó╣·┤¾č¦│╔╝©ĄźĪó├└╣·┤¾č¦│╔╝©ĄźĪó░─ų▐┤¾č¦│╔╝©ĄźĪó╝ė─├┤¾┤¾č¦│╔╝©ĄźŻ©q╬ó1954292140Ż®ą┬╝ėŲ┬┤¾č¦│╔╝©ĄźĪóą┬╬„└╝┤¾č¦│╔╝©ĄźĪó░«Č¹└╝│╔╝©ĄźĪó╬„░Óč└│╔╝©ĄźĪóĄ┬╣·│╔╝©ĄźĪŻ│╔╝©ĄźĄ─ęŌęÕų„ę¬╠ÕŽųį┌ųż├„覎░─▄┴”ĪóŲ└╣└č¦╩§▒│Š░Īóš╣╩Šū█║Ž╦žų╩Īó╠ßĖ▀┬╝╚Ī┬╩Ż¼ęį╝░╩Ūū„╬¬┴¶ą┼╚Žųż╔ĻŪļ▓─┴ŽĄ─ę╗▓┐ĘųĪŻ
╬¼┐╦┤¾č¦-╝ė╠®┬▐─ßčŪųąčļ┤¾č¦│╔╝©Ąź─▄╣╗╠ÕŽų─·Ą─Ą─覎░─▄┴”Ż¼░³└©╬¼┐╦┤¾č¦-╝ė╠®┬▐─ßčŪųąčļ┤¾č¦┐╬│╠│╔╝©Īóū©ęĄ─▄┴”Īó蹊┐─▄┴”ĪŻŻ©q╬ó1954292140Ż®Š▀╠Õ└┤╦ĄŻ¼│╔╝©▒©ĖµĄź═©│Ż░³║¼č¦╔·Ą─覎░╝╝─▄ėļŽ░╣▀ĪóĖ„┐Ų│╔╝©ęį╝░└Ž╩”Ų└ė’Ą╚▓┐ĘųŻ¼ę“┤╦Ż¼│╔╝©Ąź▓╗Į÷╩Ūč¦╔·č¦╩§─▄┴”Ą─ųż├„Ż¼ę▓╩ŪŲ└╣└č¦╔·╩Ūʱ╩╩║Ž─│Ė÷Į╠ė²ŽŅ─┐Ą─ųžę¬ę└Š▌ŻĪAdrien Matray - A Prominent Macroeconomist
Adrien Matray - A Prominent MacroeconomistAdrien Matray
?
Adrien Matray is an applied macroeconomist whose research examines how finance shapes economic growth and economic inequality. Growing up in the less affluent suburbs of Paris, where economic disparities were stark, sparked his interest in understanding how financial systems affect well-being. His work addresses critical issues like income inequality and lack of access to formal financial institutions, aiming to inform policies that better regulate alternative financial services and promote equitable economic outcomes, especially for low-income communities.Analytical procedures for audit and assurance
Analytical procedures for audit and assuranceNguytHi7
?
Didu nay iluoc sua.d6i theo-quy dinh tai Dieu 1 cua euytit dinh s6 t146l2004/eDN[{NN vd vi6c sua a6i oiau z quyciainl s6 +lstzooatqo NHt[\r 2gt4t2oo4 cira thdng ioc
Ngan hang Nhd nu6c ban hdnh HO th5ng tiri khoan k6 toan c6c T6 chric tin dung, c6 hi0u luc
kd tu ngdy 04 thaag 10 nlm 2004Middle East Conflict Sparks Oil Price Surge ©C Global Markets on Alert
Middle East Conflict Sparks Oil Price Surge ©C Global Markets on Alert Swiss International University SIU
?
Business sentiment stabilized in May, but exportersĪ» anxiety and labor shorta...
Business sentiment stabilized in May, but exportersĪ» anxiety and labor shorta...?¦▀¦Ń¦õ¦┌¦õ¦Õ¦õ ¦ų¦▄¦Ó¦▀¦Ó¦▐?¦ķ¦▀¦┌¦ń ¦š¦Ó¦Ń¦▌?¦š¦ž¦ų¦▀¦Ņ ¦õ¦č ¦ß¦Ó¦▌?¦õ¦┌¦ķ¦▀¦┌¦ń ¦▄¦Ó¦▀¦Ń¦Õ¦▌¦Ņ¦õ¦č¦Ķ?¦█
?
Ad