Adl

This document describes research analyzing sensor data from a smart home to assess activities of daily living (ADLs) like meal preparation. Sensors in the home's kitchen were used to detect events related to breakfast and dinner preparation over 31 days. Three clusters were identified for different meal preparation patterns. Analysis found consistent daily patterns for breakfast on workdays, breakfast on days off, and dinner preparation. The times and durations of kitchen activity aligned with estimated meal preparation times. This proof-of-concept demonstrates how smart home technologies can objectively and non-intrusively evaluate ADLs to help caregivers monitor independent living. Future work will analyze patterns over longer periods and detect changes indicating health problems.

![ABSTRACT
With the rapid elder population growth, there is both need and
market for effective tools that assess an elder’s ability to maintain
independence and a healthy lifestyle. The Activities of Daily Living
[ADL] and the Instrumental Activities of Daily Living [IADL] scales
provide such measures of functionality; however, current methods of
evaluation are limited to self-report or intermittent observations. The
approach proposed here enables objective, continuous and non-intrusive
evaluation of the ADL/IADL measures in the individual’s home.
This work shows how readings from sensors installed within a
person’s residence can be analyzed and combined to provide a
probabilistic evaluation on the ADL/IADL scales. The event criteria
needed to evaluate the specific ADL/IADL questions are discussed
along with the data-mining techniques used to isolate important events
and determine relationships among sensor outputs, including modelbased clustering and association rules. The question regarding the
person’s ability to prepare meals is used as an example to illustrate the
approach on real data collected from the “Smart House” site.
1](https://image.slidesharecdn.com/adl-140225031041-phpapp02/85/Adl-2-320.jpg)

Adl
- 1. OBJECTIVE REMOTE ASSESSMENT OF ACTIVITIES OF DAILY LIVING: ANALYSIS OF MEAL PREPARATION PATTERNS TRACY B ARGER, MAJD ALWAN, STEVE K ELL, B EVERELY TURNER , SARAH WOOD , AMIT N AIDU MEDICAL AUTOMATION RESEARCH CENTER
- 2. ABSTRACT With the rapid elder population growth, there is both need and market for effective tools that assess an elder’s ability to maintain independence and a healthy lifestyle. The Activities of Daily Living [ADL] and the Instrumental Activities of Daily Living [IADL] scales provide such measures of functionality; however, current methods of evaluation are limited to self-report or intermittent observations. The approach proposed here enables objective, continuous and non-intrusive evaluation of the ADL/IADL measures in the individual’s home. This work shows how readings from sensors installed within a person’s residence can be analyzed and combined to provide a probabilistic evaluation on the ADL/IADL scales. The event criteria needed to evaluate the specific ADL/IADL questions are discussed along with the data-mining techniques used to isolate important events and determine relationships among sensor outputs, including modelbased clustering and association rules. The question regarding the person’s ability to prepare meals is used as an example to illustrate the approach on real data collected from the “Smart House” site. 1
- 3. NEED AND MARKET POTENTIALS • A large percentage of elders live alone; about fifty percent of those are 75 and older • Over 5.5 million people above the age of 75 are limited by chronic conditions • There is a need for products to monitor elders to warn of problems • Approximately 23 million people are working caregivers for elders • Working caregivers benefit from products allowing them to provide necessary care more efficiently • Independent and Assisted Living Facilities also benefit from such a system to reduce burdens on staff • Use of the MARC Smart House technologies to monitor the ADL/IADL scales would provide tremendous aid to caregivers • The system, estimated at $1000, and the estimated monthly subscription fee of $15.00 per month are likely to be met with acceptance by adult children and other caregivers 2
- 4. TECHNOLOGY SUMMARY • The ADL/IADL scales score basic daily activities (independently bathe, dress, toilet, ambulate, prepare meals, eat, etc.) • Inference of the occurrence of the ADL/IADL events § Analyzing which sensors would be needed to determine each event § The combination of required sensor readings was mapped to each ADL/IADL § Analyzing the data to examine whether an event actually occurred • The “mixture of distributions” concept groups sensor firings into clusters representing different activities • Multiple event approach provides redundancy, reducing uncertainty and increasing confidence in the inferences made • Association rules find sets of events that occur frequently together and may collectively represent an activity 3
- 5. TECHNOLOGY SUMMARY • Several kitchen events were used determine meal preparation § Opening of cabinets and appliances (cereal, cookware, dishes, flatware, freezer, microwave, and stove) § Sensor in a mat in front of the stove § Temperature Sensor above the stove • Each type of event was grouped according to time of day using mixture models to form clusters • The number of other event groups that occurred within fifteen minutes following an event was calculated to form a matrix displaying the average number of times the second group occurred within fifteen minutes of the first • Hierarchical clustering (complete link) was then applied to the matrix to form sets of groups. 4
- 6. RESULTS AND ANALYSIS • Three potential clusters were identified: § During breakfast preparation on workdays § During breakfast preparation on stay-at-home days § During dinner preparation • Majority of days appear quite similar • The sensor above the stove recording temperature was used to help confirm meal preparation times § In all but three cases, the rising temperatures corresponded to the estimated meal preparation times • Motion activity in the kitchen was used to further confirm the times of meal preparation • The time in the kitchen compared to the estimated meal times, and the total length of time in the kitchen intersecting with the meal times was calculated for each day 5
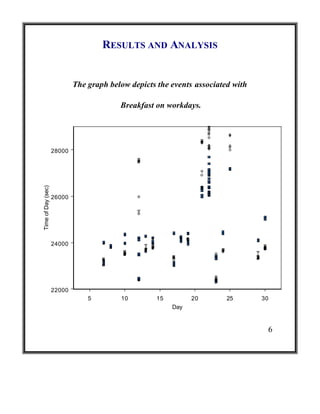
- 7. RESULTS AND ANALYSIS The graph below depicts the events associated with Breakfast on workdays. Time of Day (sec) 28000 26000 24000 22000 5 10 15 20 25 30 Day 6
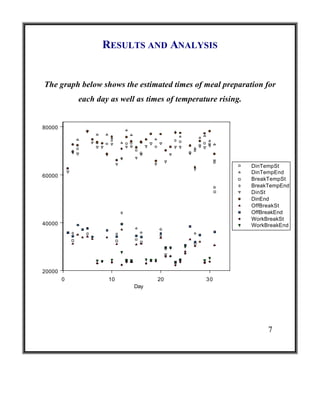
- 8. RESULTS AND ANALYSIS The graph below shows the estimated times of meal preparation for each day as well as times of temperature rising. 80000 DinTempSt DinTempEnd BreakTempSt BreakTempEnd DinSt DinEnd OffBreakSt OffBreakEnd WorkBreakSt WorkBreakEnd 60000 40000 20000 0 10 20 30 Day 7
- 9. SUMMARY OF MEAL TIMES AND PATTERNS • Breakfast analysis § Workday breakfast prep averaged between 6:39 and 7:04 AM § Involved about 18 minutes in the kitchen and 12.75 kitchen events • Off days average start/stop times were 9:05 and 9:58 § Approximately 52 minutes spent in the kitchen § Temperature sensor rose on nine off days indicating hot breakfast • Dinner preparation occurred on average between 19:17 and 20:11 § About 51 minutes spent in the kitchen § Stove temperature rose on nineteen of the 31 days • Analysis showed preparation of dinner occurred during twenty-nine of the thirty-one days; breakfast was prepared daily 8
- 10. CONCLUSIONS AND FUTURE DIRECTIONS • Meal preparation example of ADLs demonstrated using Smart House technologies § Analysis of sensor data showed relatively consistent patterns of breakfast and dinner preparation § Identified patterns could be used as a baseline to detect changes, which may indicate health problems § Future analysis will examine pattern change or consistency over time • The Smart House team is currently outfitting the test site to enable the detection of remaining ADL/IADL activities • We intend to implement the automatic inference engine for all these activities • The ADL/IADL scale is one example of daily activities evaluation using MARC Smart House technologies. Similar approach could be used to evaluate other measures or activities 9
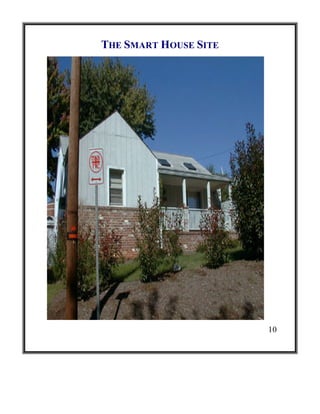
- 11. THE SMART HOUSE SITE 10