


Analysing the cascading effects on critical infrastrcture in Torbay coastal/pluvial flooding with climate change
- 1. Analysing the cascading effects on critical infrastrcture in Torbay coastal/pluvial flooding with climate change M. J. Gibson1 / A. S. Chen1 / M.Khoury1 / L. S. Vamvakeridou-Lyroudia1 / D. Stewart2 / M. Wood2 / D. A. Savić1,3 / S. Djordjević1 1 University of Exeter – Centre for Water Systems, email: M.J.Gibson@Exeter.ac.uk 2 Torbay Council 3KWR Water Cycle Research Institute, Nieuwegein, The Netherlands
- 2. Presentation Outline ÔÉò EU-Circle project introduction ÔÉò The Torbay test case ÔÉò Methodology ÔÉò Coastal overtopping ÔÉò Torbay case set-up ÔÉò Serious game and 3D visualisation
- 3. EU-Circle – Critical InfRastructure Cascade faiLurEs  EU-CIRCLE project (www.eu-circle.eu) – A pan-European framework for strengthening critical infrastructure resilience to climate change  Project case studies France, Dresden(Germany), Torbay (UK), Cyprus, and Khulna (Bangladesh)  Different models and problems addressed  Similar approaches  Loosely linked models  Cascade effects of natural hazards  Effects on critical infrastructure
- 4. EU-Circle Torbay Case study Exeter ÔÉò South West of England ÔÉò Area of approximately 62 km2 ÔÉò Settlement around coast used for industry and tourism ÔÉò Main settlements are Torquay, Paignton and Brixham Torbay Torquay Paignton Brixham
- 5. EU-Circle Torbay Case study ÔÄ™ Flooding scenarios to be tested as part of case study ÔÄ™ Coastal Flooding (1 in 200 year event) ÔÄ™ Pluvial/Fluvial Flooding (1 in 100 year event) ÔÄ™ Joint probability Event (Coastal: 1 in 50 year event, Pluvial: 1 in 100 year event) ÔÄ™ Resilience (1 in 200 year event, Paignton only) ÔÄ™ Climate change scenarios ÔÄ™ Now, 20 years, 50 years (joint probability and resilience scenario only) and 100 years ÔÄ™ Questions to be answered as part of the case study ÔÄ™ What roads are closed due to Xm depth of flooding? ÔÄ™ How many residential and commercial properties would be flooded? ÔÄ™ Identify all critical infra (assets) affected directly or indirectly by flooding? ÔÄ™ How many residents are affected by the storm event in question? ÔÄ™ What is the cost of a particular storm event? ÔÄ™ CADDIES high speed model used to perform multiple simulations http://emps.exeter.ac.uk/engineering/research/cws/resources/caddies-framework/
- 6. Methodology Data interdependencies Electricity Sub Station Telecom Exchanges /Boxes Sewer Pumping Stations Roads Rail Station and Line Buildings (Residential / Commercial) Electricity network area Sewer network area Telecom network area Point data Polygon data Coastal Event Pluvial /Fluvial Event Joint probability Event Input data Result Data Return period Climate Change Scenario Flood Depth
- 7. Telecom Network Area Pumping StationExchange Electrical Sub Station Critical Infrastructure Sewer Network Area Flooded Buildings & Road Road Diversion Electrical Network Area Methodology
- 8. Methodology Different cost curves specified for each area type Depth Cost £ Depth Cost £ Residential Commercial Road Diversion length Diversion Length Cost £/hr Rail Time of closure Cost £
- 9. Coastal Overtopping/Pluvial - Torbay Storm Emma 3rd March 2018 Torquay sea front available on YouTube: https://www.youtube.com/watch?v=Oc2Imxkp9iY  1 in 50 year tidal event, 1 in 75 year pluvial event (although largely snow too, very rare)
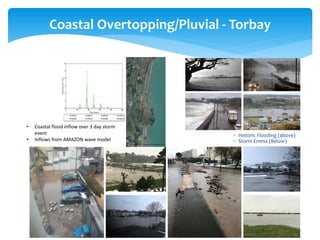
- 10. Coastal Overtopping/Pluvial - Torbay  Historic Flooding (above)  Storm Emma (Below) • Coastal flood inflow over 3 day storm event • Inflows from AMAZON wave model
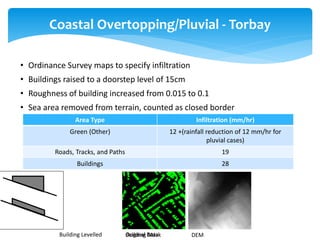
- 11. Original DataBuilding Mask DEM Coastal Overtopping/Pluvial - Torbay Building Levelled Area Type Infiltration (mm/hr) Green (Other) 12 +(rainfall reduction of 12 mm/hr for pluvial cases) Roads, Tracks, and Paths 19 Buildings 28 • Ordinance Survey maps to specify infiltration • Buildings raised to a doorstep level of 15cm • Roughness of building increased from 0.015 to 0.1 • Sea area removed from terrain, counted as closed border
- 12. Paignton Flooding results 2065 Pluvial & coastal combined costal adaptation
- 13. Direct damage (£) 1,000 – 10,000 10,000 – 50,000 50,000 – 100,000 100,000 – 500,000 500,000 – 1,000,000 1,000,000 + Indirect impact Direct impact only Low indirect impact Medium indirect impact High indirect impact Flood Impact to Paignton 1 in 200 year Coastal Overtopping Event with 50 years Climate Change 0 0 50 100 6b0 062 8 Results
- 14. 36h 48h 84h 96h 12h 24h 60h 72h Direct damage (£) 1,000 – 10,000 10,000 – 50,000 50,000 – 100,000 100,000 – 500,000 500,000 – 1,000,000 1,000,000 + Indirect impact Direct impact only Low indirect impact Medium indirect impact High indirect impact
- 15. Serious Game and 3D visualisations Linked to Google Earth and Ordnance Survey Maps for flood visualisation
- 16. Acknowledgement EU-CIRCLE project has received funding from the EU Horizon 2020 research and innovation programme GA 653824 (http://www.eu-circle.eu) Development of CADDIES was funded by the UK Engineering and Physical Sciences Research Council, grant GR/J09796 (Simplified Dual-Drainage Modelling for Flood Risk Assessment in Urban Areas). We thank the data providers:
- 17. Analysing the cascading effects on critical infrastrcture in Torbay coastal/pluvial flooding with climate change M. J. Gibson1 / A. S. Chen1 / M.Khoury1 / L. S. Vamvakeridou-Lyroudia1 / D. Stewart2 / M. Wood2 / D. A. Savić1,3 / S. Djordjević1 1 University of Exeter – Centre for Water Systems, email: M.J.Gibson@Exeter.ac.uk 2 Torbay Council 3KWR Water Cycle Research Institute, Nieuwegein, The Netherlands Thank you for listening. Are there any questions? Time for videos?
- 18. Serious Game and 3D visualisations Available at https://www.youtube.com/watch?v=gMfZPVGNw_M
- 19. Serious Game and 3D visualisations