1 of 124
Download to read offline




















Ad
Recommended
Duke Energy 3Q 03_er
Duke Energy 3Q 03_erfinance21
╠²
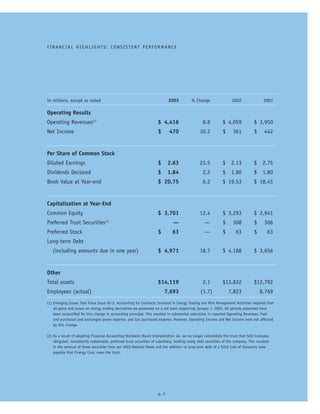
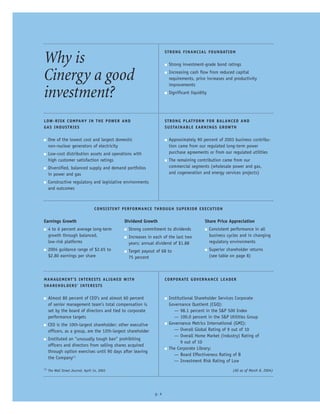
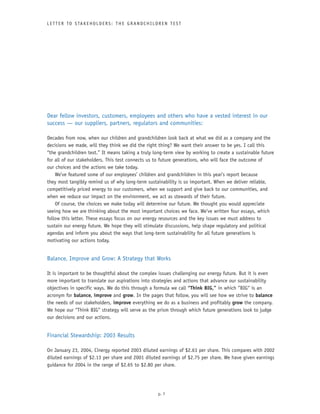
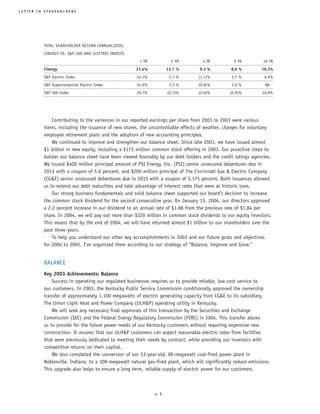
Duke Energy reported third quarter 2003 earnings per share of $0.05 compared to $0.27 in third quarter 2002. Excluding special items, earnings per share was $0.35 compared to $0.51 the previous year. The company implemented a cost reduction plan expected to reduce annual pretax expenses by over $200 million. Duke Energy is on track to pay down $1.8 billion in debt by the end of the year and $5.5 billion by the end of 2005.duke energy 20/07/08/0701f
duke energy 20/07/08/0701ffinance21
╠²
Duke Energy reported financial results for the second quarter of 2007, with ongoing diluted EPS of $0.25 compared to $0.24 in the second quarter of 2006. Higher results were seen at U.S. Franchised Electric and Gas and Commercial Power primarily due to favorable weather. These increases were offset by lower contributions from Crescent Resources due to a change in ownership structure. The company expects to exceed its annual EPS target of $1.15 for 2007.Duke-Energy 2008_Proxy
Duke-Energy 2008_Proxyfinance21
╠²
- The document is a proxy statement from Duke Energy Corporation announcing their annual shareholder meeting on May 8, 2008.
- Shareholders will vote on electing directors, ratifying Deloitte & Touche LLP as the independent public accountant, and approving an amended executive short-term incentive plan.
- The proxy statement provides details on the voting process, the board of director nominees, and the items that will be voted on at the annual meeting. Duke Energy finaltranscript7/30/03
Duke Energy finaltranscript7/30/03finance21
╠²
Duke Energy held its Q2 2003 earnings conference call on July 30, 2003. Fred Fowler, President and COO, reported that Duke Energy has made strong progress in the first half of 2003 through an asset sales program that generated over $1.5 billion, reducing capital spending to $3 billion, and lowering net debt by approximately $1.8 billion for the year. Duke Energy reported Q2 earnings of 46 cents per share including 16 cents from asset sales. For the first half of 2003, Duke Energy reported earnings of 71 cents per share including gains from asset sales and an accounting charge, with benefits from Westcoast earnings and expansion projects offset by lower DENA earnings and higher interest expenses.Duke Energy Q104Transcript
Duke Energy Q104Transcriptfinance21
╠²
This document contains the prepared remarks from Duke Energy's Q1 2004 earnings conference call. The key points are:
1) Duke Energy reported earnings of 36 cents per share including special items, and ongoing earnings of 32 cents, which met expectations despite $6 cents of MTM losses during the quarter.
2) Several business segments performed well, including franchised electric and gas transmission. Field services benefited from higher frac spreads and hedging gains.
3) Challenges included a disappointing quarter for DENA due to inability to capture optionality. However, DENA expects to realize its full-year budget.
4) Duke Energy continues reducing debt and increasing cash, made progress on legal issues, Duke Energy 4Q/03_Transcript_and_QA_-Final
Duke Energy 4Q/03_Transcript_and_QA_-Finalfinance21
╠²
Duke Energy held an earnings call to discuss its financial results for Q4 2003 and the full year. The company reported a net loss of $1.48 per share for 2003, which included $2.76 in special items. Most business segments met their targets except for Franchised Electric, which saw lower earnings due to higher costs. Duke Energy's largest loss was primarily driven by asset impairments and other special charges related to its DENA business. Management provided additional details on special items to help analysts understand the company's ongoing earnings performance excluding these one-time charges.ConAgra June92003Q&A
ConAgra June92003Q&Afinance21
╠²
ConAgra Foods is selling its chicken business to focus on branded and value-added food items. The sale includes chicken processing operations and will generate cash for ConAgra to reinvest. ConAgra will receive Class A shares in Pilgrim's Pride, the chicken company acquiring its business, representing 7% of voting shares and 49% of equity. It can sell up to 1/3 of these shares annually but expects to reduce ownership over time based on market conditions. ConAgra will also receive notes from Pilgrim's Pride due in 2011 with a 10.5% interest rate to be paid semi-annually.ConAgraFY04Q1
ConAgraFY04Q1finance21
╠²
This document summarizes the Q1 FY2004 earnings results of a large packaged foods company. Key points include:
- Q1 EPS was $0.37 compared to $0.43 in Q1 FY2003, impacted by various one-time gains and losses.
- Packaged foods sales were down $168M excluding divested businesses, with a 5% volume decline.
- Several major brands saw growth, while others like Butterball declined.
- Corporate expenses increased due to litigation expenses from a past joint venture.
- The effective tax rate for FY2004 is estimated at 38%.ConAgra UAP10-03
ConAgra UAP10-03finance21
╠²
ConAgra Foods is selling its United Agri Products business to focus on branded and value-added products, as part of a broader strategy of divesting non-core businesses over the past year including fresh beef/pork, canned seafood, and cheese operations. The sale is expected to close by December 31, 2003 for cash and $60-75 million in preferred stock. ConAgra will retain some international UAP operations generating $250 million in annual sales, concentrated in several countries. Proceeds will be used for debt paydown and general corporate purposes including acquisitions and stock buybacks.ConAgra DealClosing11-03
ConAgra DealClosing11-03finance21
╠²
ConAgra Foods divested its poultry business to focus on branded, value-added foods with strong margins and growth. The $300 million cash and 25 million Pilgrim's Pride shares valued at $245 million totaled less than the poultry business' estimated $545 million book value due to the shares being valued based on past prices, not current prices. ConAgra Foods can sell up to 1/3 of the shares each year and account for shares eligible for resale within a year as securities, and other shares using cost accounting. The poultry business was previously reported in Meat Processing but is now in Discontinued Operations.ConAgra DealClosingb11-03
ConAgra DealClosingb11-03finance21
╠²
ConAgra Foods completed the divestiture of its chicken processing and crop inputs businesses, finalizing its strategy to focus on branded, value-added food opportunities. The company received $300 million in cash and 25 million shares of Pilgrim's Pride stock worth $245 million for the chicken business. ConAgra can sell up to 1/3 of the Pilgrim's Pride shares per year and will account for the shares as securities held for resale within one year or using the cost method if the eligibility for resale is over one year away. The chicken business was previously reported as part of ConAgra's Meat Processing segment but is now in Discontinued Operations.SharePurchase12-03
SharePurchase12-03finance21
╠²
ConAgra Foods has divested several commodity businesses and acquired branded and value-added food products to focus on higher margin businesses. The company is planning a share repurchase program using cash from strong operating cash flows and recent divestitures. ConAgra expects to continue investing in growth through acquisitions and paying down debt while deploying cash to dividends, debt repayment, and share repurchases as appropriate.ConAgra Q2Dec03
ConAgra Q2Dec03finance21
╠²
The document provides a Q&A summary of ConAgra Foods' financial results for Q2 FY04 compared to Q2 FY03. Key points include:
- Q2 FY04 diluted EPS was $0.51 compared to $0.44 in Q2 FY03, impacted by $0.04 in discontinued operations in FY04 and $0.03 in divestiture expenses in FY03.
- Sales comparability was impacted by $506M in divested fresh meat businesses in FY03 and $154M in divested canned food businesses in FY03.
- Examples of brand sales growth included Banquet, Chef Boyardee, Egg BeatersConAgra Q3Mar04
ConAgra Q3Mar04finance21
╠²
Packaged Foods sales increased 4% excluding divestitures, with 2% volume growth. Several brands posted sales growth including Armour, Banquet, and Blue Bonnet, while others like ACT II and Butterball declined. Sales comparability was affected by $155 million in divested businesses last year. Operating profit grew 5% in Packaged Foods and 10% overall when adjusting for divested businesses and cost savings initiatives. The company is implementing cost cutting measures expected to save more than implementation costs in the future.ConAgra Q4Jul04
ConAgra Q4Jul04finance21
╠²
The document provides the quarterly and annual financial results for a company. Some key highlights include:
- Several consumer brands posted sales growth for the quarter including Banquet, Blue Bonnet, and Chef Boyardee, while others like ACT II and Eckrich saw declines.
- Total depreciation and amortization was around $93 million for the quarter and $352 million for the fiscal year.
- Capital expenditures were around $106 million for the quarter and $352 million for the fiscal year.
- Net interest expense was $80 million for the quarter and $275 million for the fiscal year.
- Corporate expenses were around $95 million for the quarter and $342 millionConAgra Q1Sept22-04
ConAgra Q1Sept22-04finance21
╠²
- Major brands in the Retail Products segment that posted sales growth included ACT II, Armour, Banquet, and Blue Bonnet. Brands that posted sales declines included Healthy Choice, Slim Jim, and Snack Pack.
- Retail volume increased 8% while foodservice volume was flat excluding divested businesses.
- Increased input costs negatively impacted operating profits in the Retail Products segment by approximately $45 million.
- Capital expenditures were approximately $105 million, reflecting increased investment in information systems.ConAgra Q2Dec04
ConAgra Q2Dec04finance21
╠²
This document contains the questions and answers from ConAgra Foods' Q2 FY2005 earnings call. Some key details include:
- Several major brands in the Retail Products segment posted sales growth, while others saw declines.
- Retail volume increased 7% and Foodservice volume decreased 1% excluding divested businesses.
- Capital expenditures increased significantly year-over-year due to investments in information systems.
- The company received proceeds from the sale of its minority interest in Swift Foods and shares of Pilgrim's Pride stock.Q3Mar05
Q3Mar05finance21
╠²
This document summarizes the Q3 2005 earnings results of a major food company. Some key highlights include: 1) Major brands in the Retail Products segment saw mixed sales results, with growth for brands like Chef Boyardee but declines for brands like Butterball. 2) Unit volumes declined 3% for Retail Products but increased 4% for Foodservice Products. 3) The packaged meats operations were slightly profitable but profits were over $45 million lower than the previous year. The company expects some improvement but not year-over-year profit gains for packaged meats in Q4.ConAgra Q4Jun05
ConAgra Q4Jun05finance21
╠²
This document summarizes ConAgra Foods' earnings results for fiscal year 2005 (FY05) in a question and answer format. Some key details include:
- FY05 diluted EPS was $1.23, including $0.12 in expenses that impacted comparability.
- Major brands in the Retail Products segment that saw sales growth included ACT II, Banquet, and Blue Bonnet. Brands that saw declines included Armour and Butterball.
- Retail Products volume increased 2% while Foodservice Products volume decreased 2% in Q4.
- Total depreciation and amortization was approximately $351 million for FY05 and $90 million for Q4. Capital expendituresConAgra QAFY06Q1
ConAgra QAFY06Q1finance21
╠²
The document provides the questions and answers from the Q1 FY06 earnings call for ConAgra Foods. Some key details from the summary include:
- Sales grew for major brands like Butterball but declined for brands like ACT II. Retail Products volume declined 3% while Foodservice increased 4%.
- Depreciation and amortization was $89 million. Capital expenditures were $71 million and net interest expense was $68 million. Corporate expense was $73 million.
- Gross margin was 21.6% and operating margin was 10.9%. The effective tax rate for FY06 is estimated to be 36%.ConAgra QAFY06Q2
ConAgra QAFY06Q2finance21
╠²
Major brands in the Retail Products segment that posted sales growth included ACT II, Blue Bonnet, Butterball, Kid Cuisine, Marie Callender's, Reddi-wip and Ro*Tel. Brands that posted sales declines included Armour, Banquet, Cook's, DAVID, Eckrich, Egg Beaters, Healthy Choice, Hebrew National, Hunt's, LaChoy, Orville Redenbacher, PAM, Parkay, Peter Pan, Slim Jim, Snack Pack, Swiss Miss, Van Camp's and Wesson. Retail Products volume declined 5% for the quarter while Foodservice Products volume increased 2%. Corporate expense for the quarter was approximately $103 millionConAgra QAFY06Q3
ConAgra QAFY06Q3finance21
╠²
The document provides financial information from ConAgra Foods' Q3 FY06 quarterly earnings call. Some key details include:
- Retail segment sales grew 4% and Foodservice grew 1% over the prior year. Several major brands posted sales growth while others declined.
- Gross margin was 24.8% and operating margin was 12.5% for the quarter.
- Net debt was $3.6 billion, down from $4.5 billion a year prior due to debt repayment of $500 million during the quarter.
- Capital expenditures for the quarter and fiscal year-to-date were below prior year levels. Projected fiscal year expenditures are up to $400ConAgra QAFY06Q4
ConAgra QAFY06Q4finance21
╠²
- Major brands in the Consumer Foods segment that posted sales growth in Q4 FY06 included Blue Bonnet, Chef Boyardee, DAVID, Egg Beaters, Hebrew National, and Hunt's. Brands that posted sales declines included ACT II, Banquet, Healthy Choice, Peter Pan, Slim Jim, Snack Pack, and Van Camp's.
- Consumer Foods volume declined 2% in Q4 while Food and Ingredients volume increased 1%.
- Total depreciation and amortization for Q4 was approximately $85 million and approximately $353 million for all of FY06. Capital expenditures were approximately $92 million for Q4 and $288 million for FYConAgra QAFY07Q1
ConAgra QAFY07Q1finance21
╠²
This document summarizes the Q1 FY07 financial results of ConAgra Foods. Some key highlights include:
- Consumer Foods volume increased 1% and Food and Ingredients volume increased 2% in Q1.
- Gross margin was 24.7% and operating margin was 11.7% for the quarter.
- Net debt decreased to $2.88 billion from $3.97 billion in Q1 FY06.
- Restructuring charges totaled $39 million pre-tax, impacting costs in Consumer Foods and corporate expenses.ConAgra QAFY07Q2
ConAgra QAFY07Q2finance21
╠²
Major brands in the Consumer Foods segment that posted sales growth included Egg Beaters, Healthy Choice, and Slim Jim. Brands that posted sales declines included ACT II and Blue Bonnet. Total depreciation and amortization from continuing operations was $88 million for the quarter and $177 million year-to-date. Capital expenditures were $66 million for the quarter and $111 million year-to-date. Net interest expense was $52 million for the quarter and $110 million year-to-date.ConAgra QAFY07Q3
ConAgra QAFY07Q3finance21
╠²
1) Several major brands in the Consumer Foods segment posted sales growth for the quarter, while others like ACT II and Banquet saw declines. Overall, Consumer Foods volume declined 1% excluding divested businesses.
2) Total depreciation and amortization from continuing operations was around $91 million for the quarter and $268 million year-to-date. Capital expenditures were around $147 million for the quarter and $258 million year-to-date.
3) The company's net debt at the end of the quarter was around $3 billion, with a net debt to total capital ratio of 39%.ConAgra %20Q4%20FY07%20Q&A
ConAgra %20Q4%20FY07%20Q&Afinance21
╠²
1) Several major brands in the Consumer Foods segment posted sales growth for the quarter, while others such as ACT II and Knott's Berry Farm saw declines.
2) Consumer Foods volume was flat excluding divested businesses, while Food and Ingredients volume increased 3%.
3) Capital expenditures increased significantly both for the quarter and full fiscal year compared to the previous year.More Related Content
More from finance21 (20)
ConAgraFY04Q1
ConAgraFY04Q1finance21
╠²
This document summarizes the Q1 FY2004 earnings results of a large packaged foods company. Key points include:
- Q1 EPS was $0.37 compared to $0.43 in Q1 FY2003, impacted by various one-time gains and losses.
- Packaged foods sales were down $168M excluding divested businesses, with a 5% volume decline.
- Several major brands saw growth, while others like Butterball declined.
- Corporate expenses increased due to litigation expenses from a past joint venture.
- The effective tax rate for FY2004 is estimated at 38%.ConAgra UAP10-03
ConAgra UAP10-03finance21
╠²
ConAgra Foods is selling its United Agri Products business to focus on branded and value-added products, as part of a broader strategy of divesting non-core businesses over the past year including fresh beef/pork, canned seafood, and cheese operations. The sale is expected to close by December 31, 2003 for cash and $60-75 million in preferred stock. ConAgra will retain some international UAP operations generating $250 million in annual sales, concentrated in several countries. Proceeds will be used for debt paydown and general corporate purposes including acquisitions and stock buybacks.ConAgra DealClosing11-03
ConAgra DealClosing11-03finance21
╠²
ConAgra Foods divested its poultry business to focus on branded, value-added foods with strong margins and growth. The $300 million cash and 25 million Pilgrim's Pride shares valued at $245 million totaled less than the poultry business' estimated $545 million book value due to the shares being valued based on past prices, not current prices. ConAgra Foods can sell up to 1/3 of the shares each year and account for shares eligible for resale within a year as securities, and other shares using cost accounting. The poultry business was previously reported in Meat Processing but is now in Discontinued Operations.ConAgra DealClosingb11-03
ConAgra DealClosingb11-03finance21
╠²
ConAgra Foods completed the divestiture of its chicken processing and crop inputs businesses, finalizing its strategy to focus on branded, value-added food opportunities. The company received $300 million in cash and 25 million shares of Pilgrim's Pride stock worth $245 million for the chicken business. ConAgra can sell up to 1/3 of the Pilgrim's Pride shares per year and will account for the shares as securities held for resale within one year or using the cost method if the eligibility for resale is over one year away. The chicken business was previously reported as part of ConAgra's Meat Processing segment but is now in Discontinued Operations.SharePurchase12-03
SharePurchase12-03finance21
╠²
ConAgra Foods has divested several commodity businesses and acquired branded and value-added food products to focus on higher margin businesses. The company is planning a share repurchase program using cash from strong operating cash flows and recent divestitures. ConAgra expects to continue investing in growth through acquisitions and paying down debt while deploying cash to dividends, debt repayment, and share repurchases as appropriate.ConAgra Q2Dec03
ConAgra Q2Dec03finance21
╠²
The document provides a Q&A summary of ConAgra Foods' financial results for Q2 FY04 compared to Q2 FY03. Key points include:
- Q2 FY04 diluted EPS was $0.51 compared to $0.44 in Q2 FY03, impacted by $0.04 in discontinued operations in FY04 and $0.03 in divestiture expenses in FY03.
- Sales comparability was impacted by $506M in divested fresh meat businesses in FY03 and $154M in divested canned food businesses in FY03.
- Examples of brand sales growth included Banquet, Chef Boyardee, Egg BeatersConAgra Q3Mar04
ConAgra Q3Mar04finance21
╠²
Packaged Foods sales increased 4% excluding divestitures, with 2% volume growth. Several brands posted sales growth including Armour, Banquet, and Blue Bonnet, while others like ACT II and Butterball declined. Sales comparability was affected by $155 million in divested businesses last year. Operating profit grew 5% in Packaged Foods and 10% overall when adjusting for divested businesses and cost savings initiatives. The company is implementing cost cutting measures expected to save more than implementation costs in the future.ConAgra Q4Jul04
ConAgra Q4Jul04finance21
╠²
The document provides the quarterly and annual financial results for a company. Some key highlights include:
- Several consumer brands posted sales growth for the quarter including Banquet, Blue Bonnet, and Chef Boyardee, while others like ACT II and Eckrich saw declines.
- Total depreciation and amortization was around $93 million for the quarter and $352 million for the fiscal year.
- Capital expenditures were around $106 million for the quarter and $352 million for the fiscal year.
- Net interest expense was $80 million for the quarter and $275 million for the fiscal year.
- Corporate expenses were around $95 million for the quarter and $342 millionConAgra Q1Sept22-04
ConAgra Q1Sept22-04finance21
╠²
- Major brands in the Retail Products segment that posted sales growth included ACT II, Armour, Banquet, and Blue Bonnet. Brands that posted sales declines included Healthy Choice, Slim Jim, and Snack Pack.
- Retail volume increased 8% while foodservice volume was flat excluding divested businesses.
- Increased input costs negatively impacted operating profits in the Retail Products segment by approximately $45 million.
- Capital expenditures were approximately $105 million, reflecting increased investment in information systems.ConAgra Q2Dec04
ConAgra Q2Dec04finance21
╠²
This document contains the questions and answers from ConAgra Foods' Q2 FY2005 earnings call. Some key details include:
- Several major brands in the Retail Products segment posted sales growth, while others saw declines.
- Retail volume increased 7% and Foodservice volume decreased 1% excluding divested businesses.
- Capital expenditures increased significantly year-over-year due to investments in information systems.
- The company received proceeds from the sale of its minority interest in Swift Foods and shares of Pilgrim's Pride stock.Q3Mar05
Q3Mar05finance21
╠²
This document summarizes the Q3 2005 earnings results of a major food company. Some key highlights include: 1) Major brands in the Retail Products segment saw mixed sales results, with growth for brands like Chef Boyardee but declines for brands like Butterball. 2) Unit volumes declined 3% for Retail Products but increased 4% for Foodservice Products. 3) The packaged meats operations were slightly profitable but profits were over $45 million lower than the previous year. The company expects some improvement but not year-over-year profit gains for packaged meats in Q4.ConAgra Q4Jun05
ConAgra Q4Jun05finance21
╠²
This document summarizes ConAgra Foods' earnings results for fiscal year 2005 (FY05) in a question and answer format. Some key details include:
- FY05 diluted EPS was $1.23, including $0.12 in expenses that impacted comparability.
- Major brands in the Retail Products segment that saw sales growth included ACT II, Banquet, and Blue Bonnet. Brands that saw declines included Armour and Butterball.
- Retail Products volume increased 2% while Foodservice Products volume decreased 2% in Q4.
- Total depreciation and amortization was approximately $351 million for FY05 and $90 million for Q4. Capital expendituresConAgra QAFY06Q1
ConAgra QAFY06Q1finance21
╠²
The document provides the questions and answers from the Q1 FY06 earnings call for ConAgra Foods. Some key details from the summary include:
- Sales grew for major brands like Butterball but declined for brands like ACT II. Retail Products volume declined 3% while Foodservice increased 4%.
- Depreciation and amortization was $89 million. Capital expenditures were $71 million and net interest expense was $68 million. Corporate expense was $73 million.
- Gross margin was 21.6% and operating margin was 10.9%. The effective tax rate for FY06 is estimated to be 36%.ConAgra QAFY06Q2
ConAgra QAFY06Q2finance21
╠²
Major brands in the Retail Products segment that posted sales growth included ACT II, Blue Bonnet, Butterball, Kid Cuisine, Marie Callender's, Reddi-wip and Ro*Tel. Brands that posted sales declines included Armour, Banquet, Cook's, DAVID, Eckrich, Egg Beaters, Healthy Choice, Hebrew National, Hunt's, LaChoy, Orville Redenbacher, PAM, Parkay, Peter Pan, Slim Jim, Snack Pack, Swiss Miss, Van Camp's and Wesson. Retail Products volume declined 5% for the quarter while Foodservice Products volume increased 2%. Corporate expense for the quarter was approximately $103 millionConAgra QAFY06Q3
ConAgra QAFY06Q3finance21
╠²
The document provides financial information from ConAgra Foods' Q3 FY06 quarterly earnings call. Some key details include:
- Retail segment sales grew 4% and Foodservice grew 1% over the prior year. Several major brands posted sales growth while others declined.
- Gross margin was 24.8% and operating margin was 12.5% for the quarter.
- Net debt was $3.6 billion, down from $4.5 billion a year prior due to debt repayment of $500 million during the quarter.
- Capital expenditures for the quarter and fiscal year-to-date were below prior year levels. Projected fiscal year expenditures are up to $400ConAgra QAFY06Q4
ConAgra QAFY06Q4finance21
╠²
- Major brands in the Consumer Foods segment that posted sales growth in Q4 FY06 included Blue Bonnet, Chef Boyardee, DAVID, Egg Beaters, Hebrew National, and Hunt's. Brands that posted sales declines included ACT II, Banquet, Healthy Choice, Peter Pan, Slim Jim, Snack Pack, and Van Camp's.
- Consumer Foods volume declined 2% in Q4 while Food and Ingredients volume increased 1%.
- Total depreciation and amortization for Q4 was approximately $85 million and approximately $353 million for all of FY06. Capital expenditures were approximately $92 million for Q4 and $288 million for FYConAgra QAFY07Q1
ConAgra QAFY07Q1finance21
╠²
This document summarizes the Q1 FY07 financial results of ConAgra Foods. Some key highlights include:
- Consumer Foods volume increased 1% and Food and Ingredients volume increased 2% in Q1.
- Gross margin was 24.7% and operating margin was 11.7% for the quarter.
- Net debt decreased to $2.88 billion from $3.97 billion in Q1 FY06.
- Restructuring charges totaled $39 million pre-tax, impacting costs in Consumer Foods and corporate expenses.ConAgra QAFY07Q2
ConAgra QAFY07Q2finance21
╠²
Major brands in the Consumer Foods segment that posted sales growth included Egg Beaters, Healthy Choice, and Slim Jim. Brands that posted sales declines included ACT II and Blue Bonnet. Total depreciation and amortization from continuing operations was $88 million for the quarter and $177 million year-to-date. Capital expenditures were $66 million for the quarter and $111 million year-to-date. Net interest expense was $52 million for the quarter and $110 million year-to-date.ConAgra QAFY07Q3
ConAgra QAFY07Q3finance21
╠²
1) Several major brands in the Consumer Foods segment posted sales growth for the quarter, while others like ACT II and Banquet saw declines. Overall, Consumer Foods volume declined 1% excluding divested businesses.
2) Total depreciation and amortization from continuing operations was around $91 million for the quarter and $268 million year-to-date. Capital expenditures were around $147 million for the quarter and $258 million year-to-date.
3) The company's net debt at the end of the quarter was around $3 billion, with a net debt to total capital ratio of 39%.ConAgra %20Q4%20FY07%20Q&A
ConAgra %20Q4%20FY07%20Q&Afinance21
╠²
1) Several major brands in the Consumer Foods segment posted sales growth for the quarter, while others such as ACT II and Knott's Berry Farm saw declines.
2) Consumer Foods volume was flat excluding divested businesses, while Food and Ingredients volume increased 3%.
3) Capital expenditures increased significantly both for the quarter and full fiscal year compared to the previous year.Recently uploaded (20)
Sluggish growth in the shadow of the trade war
Sluggish growth in the shadow of the trade warSuomen Pankki
╠²
Governor Olli Rehn's presentation at the Bank of Finland press conference 10 June 2025.STOCK TRADING COURSE BY FINANCEWORLD.IO (PDF)
STOCK TRADING COURSE BY FINANCEWORLD.IO (PDF)AndrewBorisenko3
╠²
Unlock the Power of the Stock Market ŌĆō Stock Trading Course by FinanceWorld.io (PDF)
Take your first step towards financial independence with FinanceWorld.ioŌĆÖs in-depth Stock Trading Course. This easy-to-follow PDF guide demystifies the stock market, providing you with all the essential tools and knowledge to begin trading with confidence.
WhatŌĆÖs Included in This Course:
Introduction to stocks and the stock market ecosystem
Understanding shares, indices, and different market sectors
How to open a brokerage account and place your first trades
Fundamental analysis: reading financial statements and news
Technical analysis: chart patterns, trends, and indicators
Time-tested strategies for beginners and experienced traders
Essential risk management techniques to protect your capital
Trading psychology: mastering emotions and staying disciplined
Real-world examples, practice exercises, and actionable tips
Who Is This PDF For?
New investors looking to enter the world of stock trading
Current traders wanting to refine their approach and strategy
Anyone seeking to build wealth through the stock market
Why Choose FinanceWorld.io?
Our expert-written guides strip away the jargon and focus on practical, real-world trading skills. With FinanceWorld.io, you gain clarity, confidence, and a proven roadmap to succeed in the markets.1.1 national service scheme studetns college government college.pptx
1.1 national service scheme studetns college government college.pptxsharath75
╠²
1.1 national service scheme studetns college government collegImpact of Demonetization on Nepal's Economy
Impact of Demonetization on Nepal's EconomyMBA-FC students
╠²
The impact of India's demonetization on the Nepalese economy is examined in this presentation, which was prepared by SOMTU MBAFC first semester students. Using current events and real-world data, it investigates how the move impacted Nepal's monetary policy, trade, remittances, and liquidity. We would appreciate your input. Please also remember to visit our website, "║▌║▌▀Żground".Invoice Factoring Broker Training | Charter Capital
Invoice Factoring Broker Training | Charter CapitalKeith Mabe
╠²
If you are new to brokering invoice factoring deals. Here is a quick primer to get you started.Financial_Statements_Presentation.pptxindia students
Financial_Statements_Presentation.pptxindia studentssandhyadeepakca
╠²
Financial_Statements_Presentation.pptxChapter 3.pptx: Location decision of firms
Chapter 3.pptx: Location decision of firmsAtoshe Elmi
╠²
This chapter analysis the effect of the location decision of the firms and its impact on the development of cities Business sentiment stabilized in May, but exportersŌĆÖ anxiety and labor shorta...
Business sentiment stabilized in May, but exportersŌĆÖ anxiety and labor shorta...ąåąĮčüčéąĖčéčāčé ąĄą║ąŠąĮąŠą╝č¢čćąĮąĖčģ ą┤ąŠčüą╗č¢ą┤ąČąĄąĮčī čéą░ ą┐ąŠą╗č¢čéąĖčćąĮąĖčģ ą║ąŠąĮčüčāą╗čīčéą░čåč¢ą╣
╠²
Key points:
Ō×ó The highest uncertainty in the 3-month perspective was recorded among exporters, 20.7%
Ō×ó The share of enterprises planning to scale down operations over a 2-year horizon rose to 5%, but 95% do not expect a decline or foresee growth
Ō×ó Labor shortages remain the main obstacle ŌĆö 63% of businesses noted this issue
Ō×ó The second most common obstacles were safety risks and rising prices
Ō×ó Power outages remain a relatively minor issue ŌĆö only 7% mentioned it
Most key indicators of business sentiment remained stable in May. The Business Activity Recovery Index remained unchanged from April at 0.13. The aggregated indicator of industrial prospects, which reflects short-term expectations, slightly declined to 0.11 from 0.12 in MarchŌĆōApril.
These are the findings of the 37th monthly survey conducted by the IER among 474 industrial enterprises.
Uncertainty in the three-month outlook remained unchanged primarily for key production indicators.
ŌĆ£However, we recorded the highest level of three-month uncertainty among exporters. Every fifth exporter ŌĆö 20.7% ŌĆö currently does not know what their export dynamics will be over the next 3ŌĆō4 months,ŌĆØ said IER Executive Director Oksana Kuziakiv.
Uncertainty decreased over longer horizons ŌĆö 6-month and 2-year periods. Currently, only 28.7% of respondents find it difficult to predict their activities two years in advance. This is the lowest share since at least October 2022, when 42.3% of businesses reported uncertainty.
ŌĆ£In May, the share of those planning to reduce their enterpriseŌĆÖs activity over two years increased to 5%. This is still a small number, though higher than AprilŌĆÖs 1.4%. Nearly 80% donŌĆÖt foresee major changes. In fact, 95% of respondents indicate that they will either remain unchanged or experience slight growth. Considering the instability, security, and economic challenges Ukraine faces, this is a very good result,ŌĆØ said Oksana Kuziakiv.
The share of enterprises that increased production in May fell from 26.2% to 19.5%, while the share of those that reduced output grew from 10% to 13.5%. The share of businesses planning to increase production in the next 3ŌĆō4 months slightly declined, from 40.8% to 39.9%.
The total share of enterprises operating at full or near-full production capacity slightly increased in May, from 62% to 63%.
ŌĆ£In January this year, the share of those operating at over 75% of capacity rose significantly. Since then, it has remained relatively unchanged. For example, in May, 53% of companies were in this category,ŌĆØ noted Oksana Kuziakiv.
Expectations for new orders remain cautious: the share of companies with order portfolios longer than a year slightly decreased, from 16% to 15%. On average, the duration of new orders increased from 4.9 to 5 months.
ŌĆ£This happened because the share of those with orders for just one to two months declined from 33% to 24%. Likely, these orders were redistributed: some now work ŌĆśon the fly,ŌĆÖ others shifted into the three-to-five month category,Questions for FCRA Seminar latest Dec 12, 2023
Questions for FCRA Seminar latest Dec 12, 2023imccci
╠²
Questions for FCRA Seminar latest Dec 12, 2023How Abhay Bhutada Foundation Strengthens Cultural Education at Shivsrushti.pdf
How Abhay Bhutada Foundation Strengthens Cultural Education at Shivsrushti.pdfSwapnil Pednekar
╠²
This presentation highlights how the Abhay Bhutada Foundation is actively strengthening cultural education through its long-term support of Shivsrushti, a heritage theme park near Pune dedicated to the life of Chhatrapati Shivaji Maharaj. By funding regular maintenance, technological upgrades, and inclusive programs, the Foundation ensures that Shivsrushti remains an engaging learning space for students and visitors. The park combines traditional craftsmanship with digital storytelling to make history accessible and memorable. It also empowers local youth and artisans through training and employment while promoting hands-on education through creative workshops. With plans for future expansion, Shivsrushti stands as a living example of cultural preservation powered by collaboration and philanthropy.Issues of Trust Returns-ITR 7 CA. Ashok D. Mehta
Issues of Trust Returns-ITR 7 CA. Ashok D. Mehtaimccci
╠²
Issues of Trust Returns-ITR 7 CA. Ashok D. Mehta
Contribution of Remittance in Nepalese Economy.pdf
Contribution of Remittance in Nepalese Economy.pdfMBA-FC students
╠²
This presentation, which was prepared by SOMTU MBAFC first semester students, emphasizes the important significance that remittances have in Nepal's economy. It examines current trends, economic effects, and suggestions for policy using the most recent data from the World Bank and other trustworthy sources. We welcome your opinions and recommendations. Visit "║▌║▌▀Żground", our official website, for other presentations.Financial_Statements_Presentation (1).pptx
Financial_Statements_Presentation (1).pptxsandhyadeepakca
╠²
Financial_Statements_Presentation (1).pptxINVESTMENT ANALYSIS AND PORTFOLIO MANAGEMENT-1.pptx
INVESTMENT ANALYSIS AND PORTFOLIO MANAGEMENT-1.pptxAnkush Upadhyay
╠²
This presentation analyzes investment strategies for a 30-year-old risk-averse investor with Ōé╣50 lakhs. Based on a 35:65 equity-debt allocation, it recommends equity investments in HAL, BEL, and Bajaj Auto due to their strong financials and low debt, and debt investments in government and tax-free bonds with stable yields. The analysis balances risk and return for long-term portfolio growth in the defense sector and public sector bonds.2025 RWA Report: When Crypto Gets Real | CoinGecko
2025 RWA Report: When Crypto Gets Real | CoinGeckoCoinGecko Research
╠²
The revival of real world assets (RWA) in crypto marked one of 2024ŌĆÖs most quietly transformative narratives. While attention remained fixated on memecoins, Layer 2 ecosystems, and political betting markets, RWA steadily evolved from a niche experiment into one of the most credible and capitalized sectors in crypto.
So, how far have the core RWA verticals come since the start of 2024?
WeŌĆÖve summarized the key highlights, but be sure to dig into the full 18 slides below.Business sentiment stabilized in May, but exportersŌĆÖ anxiety and labor shorta...
Business sentiment stabilized in May, but exportersŌĆÖ anxiety and labor shorta...ąåąĮčüčéąĖčéčāčé ąĄą║ąŠąĮąŠą╝č¢čćąĮąĖčģ ą┤ąŠčüą╗č¢ą┤ąČąĄąĮčī čéą░ ą┐ąŠą╗č¢čéąĖčćąĮąĖčģ ą║ąŠąĮčüčāą╗čīčéą░čåč¢ą╣
╠²
Ad