Lanteigne line9hearing
- 1. Waterloo Moraine & Risks of Line 9 Reversal to Canada's GDP and food security. By Louisette Lanteigne butterflybluelu@rogers.com
- 2. Aquifers: The key to Waterloo Region's prosperity
- 3. Waterloo Region's Water Supply The Regional Municipality of Waterloo is Canada's largest municipality to rely almost entirely on groundwater. (75% wells, 25% the Grand River) Over 100 interconnected wells are used to supply drinking water to an ever growing population of close to 1 million people that reside in one of Ontario's main economic growth areas.
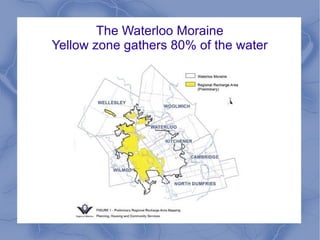
- 4. The Waterloo Moraine Yellow zone gathers 80% of the water
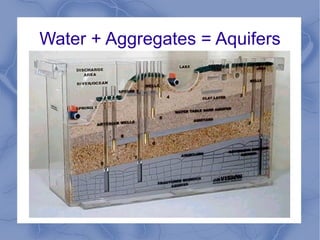
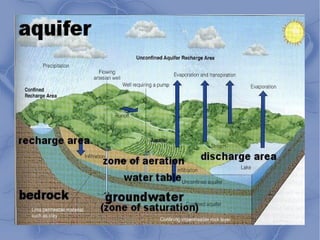
- 5. Water + Aggregates = Aquifers
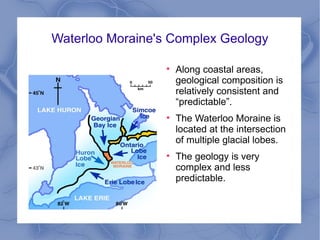
- 7. Waterloo Moraine's Complex Geology ïŽ Along coastal areas, geological composition is relatively consistent and âpredictableâ. ïŽ The Waterloo Moraine is located at the intersection of multiple glacial lobes. ïŽ The geology is very complex and less predictable.
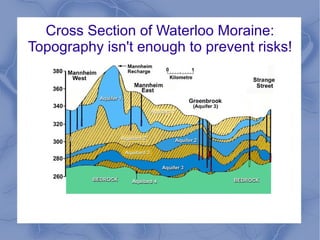
- 8. Cross Section of Waterloo Moraine: Topography isn't enough to prevent risks!
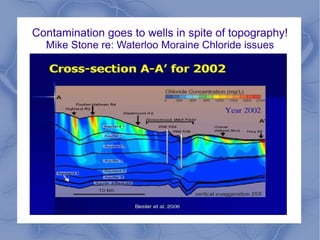
- 9. Contamination goes to wells in spite of topography! Mike Stone re: Waterloo Moraine Chloride issues
- 10. Waterloo Moraine and Grand River's contribution to the GDP
- 11. Waterloo Region's economic contributions Waterloo has a skilled and talented workforce of 282,300 (2010) $19.5 billion GDP, with a 5.8% increase from 2009 to 2010 (2010) Canadaâs second most manufacturing intensive economy; 20% of our employed population (2008) Canadaâs 10th and Ontarioâs 4th largest urban area (2010) One of Canadaâs fastest growing communities, with a population of 543,700 people that is projected to reach 729,000 people by 2031 74,000 full-time post-secondary students, including 15,000 co-operative education students University of Waterlooâs Schlegel-UW Research Institute for Aging (including the Agri-Food for Healthy Aging [A-HA] initiative) Conestoga Collegeâs Institute for Food Processing Technology Close proximity to the University of Guelph, a leading agri-food research institution. WATERLOO REGION PROFILE FOR 2011 -2014 STRATEGIC PLANNING PROCESS
- 12. Grand River - -Provides 25% of Waterloo Region's water and 100% of the water supply for Brantford, Brent County and Six Nations. - The Grand supports the same gross national revenue as the province of Nova Scotia. (State of the Grand River Watershed, GRCA) - Natural Heritage River contains 51% of Canada's native fish species including threatened and endangered species - River and tributaries support commercial fishing, tourism, birding, boating, trails and recreational use -Recharges Lake Erie
- 13. Waterloo Moraine & Agricultural Industries
- 14. Waterloo Region's Agricultural industries Waterloo is the second largest foodbelt in Ontario: Total gross farm receipts in 2005 for all farms in Waterloo Region totalled almost $400 million. Agriculture represents the largest land use activity in Waterloo Region WATERLOO REGION PROFILE FOR 2011 -2014 STRATEGIC PLANNING PROCESS .
- 15. Waterloo Agriculture Cont. Although direct employment numbers on the farm are minimal, the impact of our access to agricultural land and product on employment across the entire food industry, from research, processing and end users is enormous. WATERLOO REGION PROFILE FOR 2011 -2014 STRATEGIC PLANNING PROCESS
- 16. LEADING FOOD COMPANIES IN WATERLOO REGION (some examples) Schneider-Maple Leaf Foods - Kitchener meat processing since 1886 and inventor of the official Oktoberfest Sausage Dare Foods â Family owned since 1892 Frito Lay â One of North America's largest snack food companies Weston Bakeries â Variety of fresh fresh, frozen frozen and speciality bakery products Pillers Sausages & Delicatessens â A 1957 butcher shop that evolved into one of North America's Largest producers of sausages and deli meats Elmira Poultry â One of Canada's largest meat suppliers since 1985 Tamming Foods LTD. â Sugar wafer products Delft Blue Inc. â Milk fed veal supplier and meat packer, fresh case ready milk and grain fed veal DC Food Processing â Packer, private label batter, breaded chicken, fish, veal and cheese
- 17. Minimal Sociological Impacts With Climate Change, the Gulf Spill, the Tar Sands and the Kalamazoo oil spill it is reasonable that the public becomes upset when planning matters regarding fossil fuels are affecting their area. The public has witnessed the damage and they understand the science. They know the risks are real Waterloo Region lost 80% of our apple crops, 40-50% of our peaches and we'll have no harvests of plumbs or cherry this year. 100 million in damages for apples alone in Ontario.. In this age it is unreasonable to assume that any oil pipeline will only have minimal sociological impacts.
- 18. Enbridge's Insurance coverage for oil spills has not always been sufficient.
- 19. Case example #1: Enbridge has promises that there would be more than $1.4 billion available for clean up in the event of an oil spill.* * Sources for this funding include ship-owner's insurance, the Canada Ship Source Fund, the International Oil Pollution Fund and the Supplemental International Oil Pollution Fund,
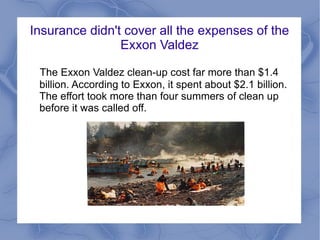
- 20. Insurance didn't cover all the expenses of the Exxon Valdez The Exxon Valdez clean-up cost far more than $1.4 billion. According to Exxon, it spent about $2.1 billion. The effort took more than four summers of clean up before it was called off.
- 21. Case example #2: With the Kalamazoo spill, Enbridge exceeded their insured clean up coverage of $600 million and now estimates that the clean-up will cost more than $720 million. (source: The Tyee article: Economist Calls Gateway Pipeline an Inflationary 'Threat')
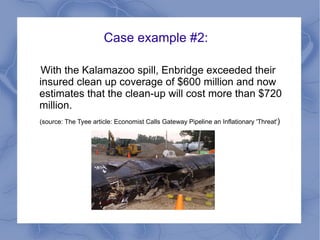
- 22. Economists warn about further inadequate insurance coverage issues with Enbridge: Robyn Allan, the former president and CEO of the Insurance Corporation of British Columbia, characterizes the reduction of Enbridge's insurance coverage for oil spills to $575 million for the Northern Gateway as "likely insufficient" to cover the cost of any real spills along the 1,000 kilometre pipeline over mountainous terrain.
- 23. What needs to be addressed The technology, laws and regulations, and practices for containing, responding to, and cleaning up spills lag behind the real risks and associated costs.
- 24. How much is 1% of the Waterloo Region's Water Supply in terms of basic water costs? (*Not counting it's function for industrial or agricultural use.)
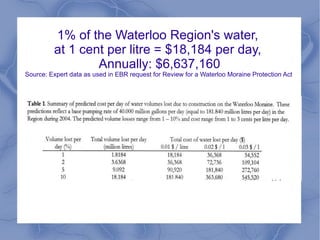
- 25. 1% of the Waterloo Region's water, at 1 cent per litre = $18,184 per day, Annually: $6,637,160 Source: Expert data as used in EBR request for Review for a Waterloo Moraine Protection Act
- 26. How to improve testing to avoid risks With climate change we are experiencing unpredictable weather patterns. If you overlap precipitation patterns in Waterloo Region for 2008 and 2011 they are the complete opposite. We had the same precipitation levels but dramatic variability as to when rains showed up. Spring thaw or heavy rains can cause pipes to sink and break, especially in primary recharge areas. To avoid structural integrity issues, mandate mandatory spring thaw testing & bore hole data to assess sediment composition and water tables and be sure to check for seasonal variants so we can avoid risks.
- 27. Hill slopes can be recharge areas! Even hill slopes can be active recharge areas if they are part of an outwash moraine system. The shingle like sediment distribution makes bore hole data unreliable as it gives false positives that slopes are impervious. These slopes can contain high recharge zones in between. Ground Penetrating Radar (GPR) systems are far more accurate to assess risks to water tables in these areas.
- 28. Modflow has it's flaws so back it up with further data. Many hydrology firms use Modflow programs to study aquifers but the program assumes aquifers are self contained and this poses a risk. Data input is often subjective which is why mandatory testing standards and methods are needed to clarify processes to explain where the numbers came from and how they came to the results. Make sure the data being used is current. Modflow works better when supported with localized geological data including sediment type to better understand actual hydrological connectivity.
- 29. Better bore holes = better risk prevention. Waterloo's Aquifers are a multilayered, interconnected aquifer system and it is extremely difficult if not impossible in some cases to secure reasonable hydraulic containment should a spill occur. To better understand our moraine, we need deep bore hole testing of 100 m or more to see what aquifers may be impacted should a spill happen, in order to adequately protect municipal, agricultural and industrial water supplies.
- 30. Abandoned wells pose a risk In Waterloo Region, there are numerous old unused wells that provide a direct line for contaminants to reach groundwater aquifers. We must make sure that wells are capped properly, especially in proximity to pipelines in order to prevent contamination risks.
- 31. Regarding Rare Species Animals such as the Wavy-Rayed Lampmussel, the Rainbow Mussel are federally protected and they live in the Grand River and area tributaries however, EIS studies often fail to have regard for mollusk studies. In wetlands we have Jefferson Salamanders. Be sure amphibian studies for these species using appropriate testing methods at the correct time of the year.
- 32. What if disaster strikes?
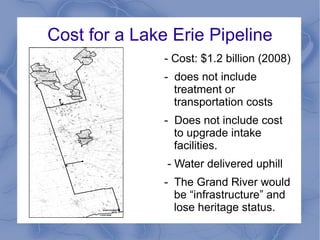
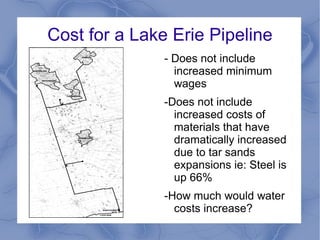
- 33. Cost for a Lake Erie Pipeline - Cost: $1.2 billion (2008) - does not include treatment or transportation costs - Does not include cost to upgrade intake facilities. - Water delivered uphill - The Grand River would be âinfrastructureâ and lose heritage status.
- 34. Cost for a Lake Erie Pipeline - Does not include increased minimum wages -Does not include increased costs of materials that have dramatically increased due to tar sands expansions ie: Steel is up 66% -How much would water costs increase?
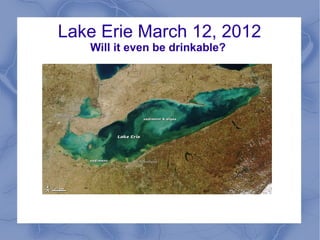
- 35. Lake Erie March 12, 2012 Will it even be drinkable?
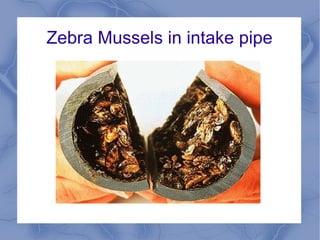
- 36. Zebra Mussels in intake pipe ar
- 37. Toxic Blue Green Algae
- 38. To protect communities and the economy, realistically assess the monetary risks and let us make source water protection the highest priority!


![Waterloo Region's economic contributions
Waterloo has a skilled and talented workforce of 282,300 (2010)
$19.5 billion GDP, with a 5.8% increase from 2009 to 2010 (2010)
Canadaâs second most manufacturing intensive economy; 20% of our employed
population (2008)
Canadaâs 10th and Ontarioâs 4th largest urban area (2010)
One of Canadaâs fastest growing communities, with a population of 543,700
people that is projected to reach 729,000 people by 2031
74,000 full-time post-secondary students, including 15,000 co-operative
education students
University of Waterlooâs Schlegel-UW Research Institute for Aging (including the
Agri-Food for Healthy Aging [A-HA] initiative)
Conestoga Collegeâs Institute for Food Processing Technology
Close proximity to the University of Guelph, a leading agri-food research
institution.
WATERLOO REGION PROFILE FOR 2011 -2014 STRATEGIC PLANNING PROCESS](https://image.slidesharecdn.com/lanteigneline9hearing-120610184611-phpapp02/85/Lanteigne-line9hearing-11-320.jpg)
