Mutation Analysis vs. Code Coverage in Automated Assessment of StudentsтАЩ Testing Skills
- 2. What┬аDo┬аWe┬аDo?┬а тАвтАп Believe┬аin┬аtesGng┬а тАвтАп Provide┬аprogramming┬аassignments┬а тАУтАпfor┬аhundreds┬аof┬аstudents┬аper┬аcourse┬а тАУтАпwhere┬аstudents┬аare┬аasked┬аto┬аsubmit:┬а тАвтАп Their┬аimplementaGon┬а тАвтАп Unit┬аtests┬аcovering┬аtheir┬аown┬аimplementaGon┬а тАУтАпUse┬аWebтАРCat┬аfor┬аautomated┬аassessment┬а тАвтАп Grade┬а=┬а┬а ┬аour┬аtests┬аpassing┬а(%)┬а*┬аstudentтАЩs┬аtests┬аpassing┬а(%)┬а*┬а ┬аline┬аor┬аbranch┬аcoverage┬аof┬аstudentтАЩs┬аtests┬а┬а┬а
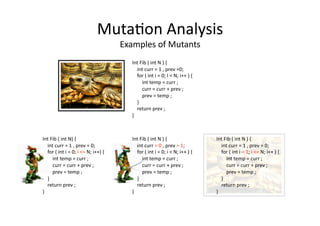
- 4. тАвтАп Create┬аvariaGons┬аautomaGcally┬аfrom┬аthe┬аoriginal┬а program┬а тАвтАп Simulate┬аbugs┬а тАвтАп A┬аgood┬аtest┬аwill┬аcatch┬аmany┬аof┬аthese┬аmutants┬а тАвтАп Assuming┬аthese┬аmutants┬аare┬аreally┬аdiямАerent┬аfrom┬аthe┬аoriginal┬а тАвтАп We┬аhope┬аthis┬аto┬аprovide┬аbe2er┬аfeedback/grading┬а тАвтАп We┬аused┬аa┬аbyteтАРcode┬аlevel┬аmutaGon┬аanalysis┬аtool┬а called┬аJavalanche┬а MutaGon┬аAnalysis┬а
- 5. тАвтАп Create┬аvariaGons┬аautomaGcally┬аfrom┬аthe┬аoriginal┬а program┬а тАвтАп Simulate┬аbugs┬а тАвтАп A┬аgood┬аtest┬аwill┬аcatch┬аmany┬аof┬аthese┬аmutants┬а тАвтАп Assuming┬аthese┬аmutants┬аare┬аreally┬аdiямАerent┬аfrom┬аthe┬аoriginal┬а тАвтАп We┬аhope┬аthis┬аto┬аprovide┬аbe2er┬аfeedback/grading┬а тАвтАп We┬аused┬аa┬аbyteтАРcode┬аlevel┬аmutaGon┬аanalysis┬аtool┬а called┬аJavalanche┬а MutaGon┬аAnalysis┬а
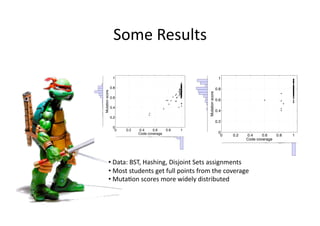
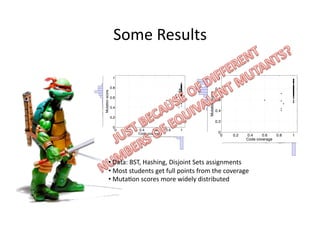
- 7. Some┬аResults┬а 0 0.2 0.4 0.6 0.8 1 0 0.2 0.4 0.6 0.8 1 Code coverage Mutationscore 0 0.2 0.4 0.6 0.8 1 0 0.2 0.4 0.6 0.8 1 Code coverage Mutationscore тАвтАп┬аData:┬аBST,┬аHashing,┬аDisjoint┬аSets┬аassignments┬а тАвтАп┬аMost┬аstudents┬аget┬аfull┬аpoints┬аfrom┬аthe┬аcoverage┬а тАвтАп┬аMutaGon┬аscores┬аmore┬аwidely┬аdistributed┬а
- 8. Some┬аResults┬а 0 0.2 0.4 0.6 0.8 1 0 0.2 0.4 0.6 0.8 1 Code coverage Mutationscore 0 0.2 0.4 0.6 0.8 1 0 0.2 0.4 0.6 0.8 1 Code coverage Mutationscore тАвтАп┬аData:┬аBST,┬аHashing,┬аDisjoint┬аSets┬аassignments┬а тАвтАп┬аMost┬аstudents┬аget┬аfull┬аpoints┬аfrom┬аthe┬аcoverage┬а тАвтАп┬аMutaGon┬аscores┬аmore┬аwidely┬аdistributed┬а
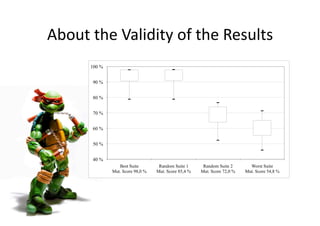
- 9. About┬аthe┬аValidity┬аof┬аthe┬аResults┬а 40 % 50 % 60 % 70 % 80 % 90 % 100 % Best Suite Mut. Score 98,0 % Random Suite 1 Mut. Score 85,4 % Random Suite 2 Mut. Score 72,0 % Worst Suite Mut. Score 54,8 %
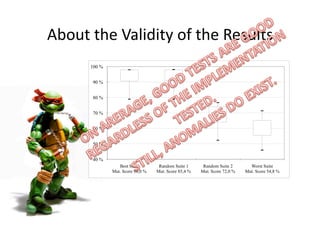
- 10. About┬аthe┬аValidity┬аof┬аthe┬аResults┬а 40 % 50 % 60 % 70 % 80 % 90 % 100 % Best Suite Mut. Score 98,0 % Random Suite 1 Mut. Score 85,4 % Random Suite 2 Mut. Score 72,0 % Worst Suite Mut. Score 54,8 %
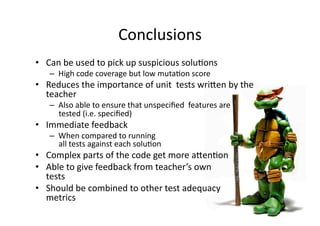
- 11. Conclusions┬а тАвтАп Can┬аbe┬аused┬аto┬аpick┬аup┬аsuspicious┬аsoluGons┬а тАУтАп High┬аcode┬аcoverage┬аbut┬аlow┬аmutaGon┬аscore┬а тАвтАп Reduces┬аthe┬аimportance┬аof┬аunit┬а┬аtests┬аwri2en┬аby┬аthe┬а teacher┬а тАУтАп Also┬аable┬аto┬аensure┬аthat┬аunspeciямБed┬а┬аfeatures┬аare┬а┬а tested┬а(i.e.┬аspeciямБed)┬а тАвтАп Immediate┬аfeedback┬а тАУтАп When┬аcompared┬аto┬аrunning┬а┬а all┬аtests┬аagainst┬аeach┬аsoluGon┬а тАвтАп Complex┬аparts┬аof┬аthe┬аcode┬аget┬аmore┬аa2enGon┬а тАвтАп Able┬аto┬аgive┬аfeedback┬аfrom┬аteacherтАЩs┬аown┬а tests┬а тАвтАп Should┬аbe┬аcombined┬аto┬аother┬аtest┬аadequacy┬а┬а metrics┬а
- 12. Future┬аDirecGons┬а тАвтАп Evaluate┬аin┬аpracGce┬а тАвтАп Data┬аwe┬аanalyzed┬аis┬аfrom┬аa┬аcourse┬а where┬аtradiGonal┬аcoverage┬аwas┬аused┬аto┬а provide┬аfeedback┬аfrom┬аtests.┬а тАвтАп Testability┬атАУ┬аTest┬аAdequacy┬атАУ┬аCorrectness┬а тАвтАп Use┬аsource┬аcode┬аmutants┬аdirectly┬аas┬а feedback┬а

