ndvi ndbi digital image processing
ŌĆó
1 likeŌĆó797 views

The document compares normalized difference vegetation index (NDVI) values calculated from Landsat 5 imagery from 1999 and 2011 for the cities of Ujjain and Haridwar, India. For both cities, it finds increases in urban area and water bodies and decreases in vegetation over time. It also provides calculations of land cover changes in square kilometers between the two time periods based on pixel counts.

ndvi ndbi digital image processing
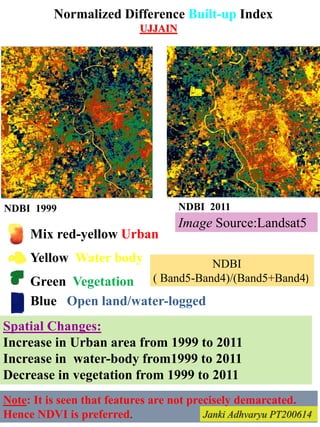
- 1. Normalized Difference Built-up Index UJJAIN NDBI 1999 NDBI 2011 Mix red-yellow Urban Yellow Water body Green Vegetation Blue Open land/water-logged Spatial Changes: Increase in Urban area from 1999 to 2011 Increase in water-body from1999 to 2011 Decrease in vegetation from 1999 to 2011 NDBI ( Band5-Band4)/(Band5+Band4) Note: It is seen that features are not precisely demarcated. Hence NDVI is preferred. Image Source:Landsat5 Janki Adhvaryu PT200614
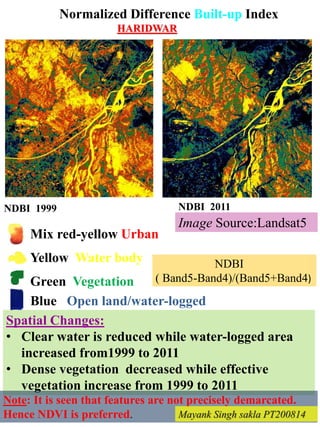
- 2. Normalized Difference Built-up Index HARIDWAR NDBI 1999 NDBI 2011 Mix red-yellow Urban Yellow Water body Green Vegetation Blue Open land/water-logged Spatial Changes: ŌĆó Clear water is reduced while water-logged area increased from1999 to 2011 ŌĆó Dense vegetation decreased while effective vegetation increase from 1999 to 2011 NDBI ( Band5-Band4)/(Band5+Band4) Note: It is seen that features are not precisely demarcated. Hence NDVI is preferred. Image Source:Landsat5 Mayank Singh sakla PT200814
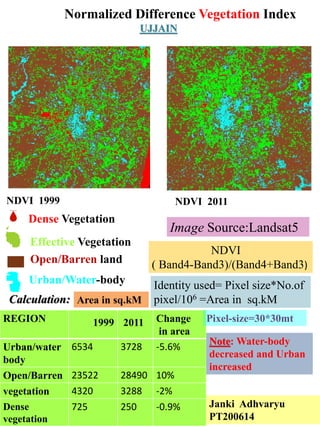
- 3. Normalized Difference Vegetation Index UJJAIN NDVI 1999 NDVI 2011 NDVI ( Band4-Band3)/(Band4+Band3) Dense Vegetation Effective Vegetation Open/Barren land Urban/Water-body Image Source:Landsat5 Calculation: Identity used= Pixel size*No.of pixel/106 =Area in sq.kM REGION 1999 2011 Change in area Urban/water body 6534 3728 -5.6% Open/Barren 23522 28490 10% vegetation 4320 3288 -2% Dense vegetation 725 250 -0.9% Pixel-size=30*30mt Janki Adhvaryu PT200614 Note: Water-body decreased and Urban increased Area in sq.kM
- 4. Normalized Difference Vegetation Index HARIDWAR NDVI 1999 NDVI 2011 NDVI ( Band4-Band3)/(Band4+Band3) Dense Vegetation Effective Vegetation Water-body Image Source:Landsat5 Calculation: Identity used= Pixel size*No.of pixel/106 =Area in sq.kM REGION 1999 2011 Change in area Dense vegetation 7533 890 -13% vegetation 7844 16390 16.3% Urban/water logged 34285 14350 -38.5% Water-body 2130 20350 34% Pixel-size=30*30mt Urban/Water-logged Mayank Singh Sakla (PT200814) Area in sq.kM ŌĆó Water-body, urban increased ŌĆó Dense forest , water-logged decreased