Pinpoint, Prepare, and Perform with Web Analytics
- 1. Pinpoint, Prepare, and Perform with Web Analytics Katie Vojtko Marketing Specialist, DonorPro by TowerCare Technologies kvojtko@towercare.com | towercare.com
- 2. A Few Questions to Get Started ŌŚÅ What online tools does your nonprofit use (website, email, social media, etc.)? ŌŚÅ What are some of your challenges and issues with online analytics? ŌŚÅ What kind of tools/information are you looking to gain from this morning?
- 3. What to Expect: 1. Google Analytics (~1 hour) 2. Break (~15 minutes) 3. Email Analytics, Mail Chimp & Constant Contact (~30 minutes) 4. Social Media Analytics & Tools (~45 minutes) Questions, Conversation, and Story/Advice Sharing are Encouraged!
- 4. Google Analytics, What is It? Google Analytics is a powerful tool that analyzes: ŌŚÅ Website Traffic ŌŚŗ Where visitors come from ŌŚŗ How they are navigating to your site ŌŚÅ Conversions ŌŚÅ E-commerce ŌŚÅ AdWords Performance
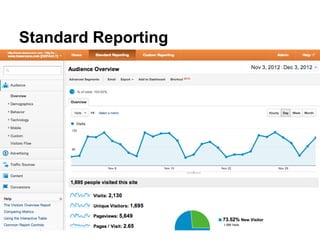
- 5. Basics: Visits Visits are the number of sessions that occur on your website. A visit is, as close as possible, one person who views one or more pages on the site. If the same person comes back, thatŌĆÖs two visits. More visits to a site equates, basically, to more ŌĆ£trafficŌĆØ and, potentially, more people in general seeing the site.
- 6. Basics: Pageviews Pageviews are the number of pages on your site that were viewed. Generally, each link you click takes you to a new page. If, in one month, 1,000 people went to the homepage, clicked on an article, clicked on another article, and then went elsewhere, that month would have 3,000 page views.
- 7. Basics: Pages/visit Dividing total page views by total visits gives the average number of pages that are viewed per visit. Blog-type sites typically have a pages/visit number between 1.5 and 2. An increasing pages/visit number shows that visitors are clicking on more pages on the site per visit.
- 8. Basics: Bounce rate The bounce rate is the percentage of people who see one page and leave the site (essentially ŌĆ£bouncingŌĆØ off of a page). Bounce rate is affected by the same things that the pages/visit number is: site design, reader engagement, availability of related content, etc.
- 9. Basics: % New Visits This is the percentage of the total visits that came from new visitors. Though potentially inaccurate, this is a number whose trends are useful to watch. An increase in % new visits could be an indication of extended online influence while a decrease could mean improved reader engagement.
- 10. Configurations ŌŚÅ Filters ŌŚÅ Adding Profiles ŌŚÅ Custom Segmentation ŌŚÅ Goals ŌŚÅ E-Commerce Tracking
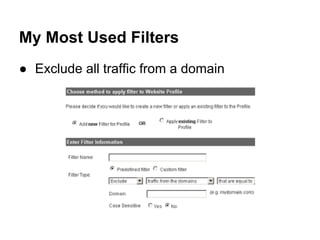
- 11. My Most Used Filters ŌŚÅ Exclude all traffic from a domain
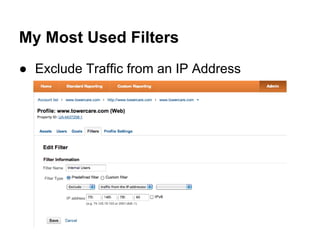
- 12. My Most Used Filters ŌŚÅ Exclude Traffic from an IP Address
- 13. Configurations ŌŚÅ Filters ŌŚÅ Adding Profiles ŌŚÅ Custom Segmentation ŌŚÅ Goals ŌŚÅ E-Commerce Tracking
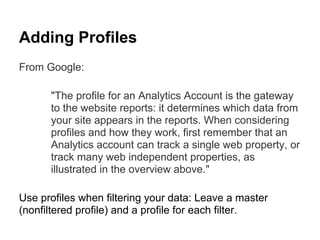
- 14. Adding Profiles From Google: "The profile for an Analytics Account is the gateway to the website reports: it determines which data from your site appears in the reports. When considering profiles and how they work, first remember that an Analytics account can track a single web property, or track many web independent properties, as illustrated in the overview above." Use profiles when filtering your data: Leave a master (nonfiltered profile) and a profile for each filter.
- 15. Configurations ŌŚÅ Filters ŌŚÅ Adding Profiles ŌŚÅ Custom Segmentation ŌŚÅ Goals ŌŚÅ E-Commerce Tracking
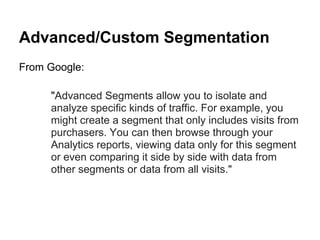
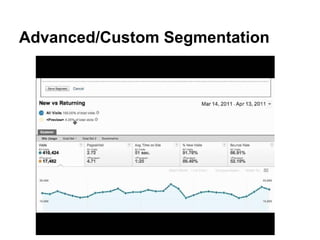
- 16. Advanced/Custom Segmentation From Google: "Advanced Segments allow you to isolate and analyze specific kinds of traffic. For example, you might create a segment that only includes visits from purchasers. You can then browse through your Analytics reports, viewing data only for this segment or even comparing it side by side with data from other segments or data from all visits."
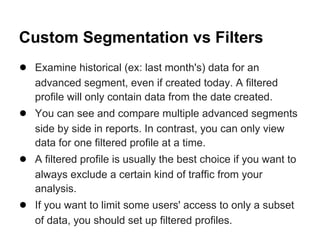
- 17. Custom Segmentation vs Filters ŌŚÅ Examine historical (ex: last month's) data for an advanced segment, even if created today. A filtered profile will only contain data from the date created. ŌŚÅ You can see and compare multiple advanced segments side by side in reports. In contrast, you can only view data for one filtered profile at a time. ŌŚÅ A filtered profile is usually the best choice if you want to always exclude a certain kind of traffic from your analysis. ŌŚÅ If you want to limit some users' access to only a subset of data, you should set up filtered profiles.
- 19. Configurations ŌŚÅ Filters ŌŚÅ Adding Profiles ŌŚÅ Custom Segmentation ŌŚÅ Goals ŌŚÅ E-Commerce Tracking
- 20. Kinds of Goals: Goals and Funnels are a versatile way to measure how well your site or app fulfills your target objectives. Examples: ŌŚÅ Conversion Rate ŌŚÅ Reports ŌŚÅ "Thank You" Page ŌŚÅ Contact / Buy / Download / Register
- 21. Types of Goals: ŌŚÅ URL Destination: A specific location, like a web page, has loaded. For example, a Thank you for registering! web page may be a destination. ŌŚÅ Visit Duration: Visits that lasts a specific amount of time or longer. You could use this Goal to determine how many visitors stay longer than two minutes on a designated screen. ŌŚÅ Page/Visit: A visitor views a specific number of pages or screens in a visit. ŌŚÅ Event: A visitor triggers an action youŌĆÖve defined as an Event, like a social recommendation or an ad click.
- 22. Configurations ŌŚÅ Filters ŌŚÅ Adding Profiles ŌŚÅ Custom Segmentation ŌŚÅ Goals ŌŚÅ E-Commerce Tracking
- 23. Reporting and Settings ŌŚÅ Dashboard/Home ŌŚÅ Standard Reporting ŌŚÅ Custom Reporting ŌŚÅ Admin ŌŚÅ Help
- 24. Dashboard
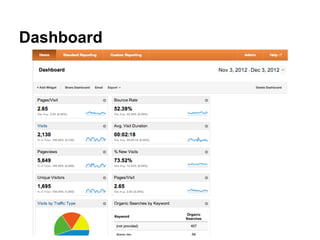
- 25. Dashboard ŌŚÅ Configurable widgets ŌŚÅ Snapshot of your activity
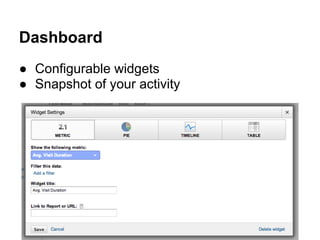
- 26. Reporting and Settings ŌŚÅ Dashboard/Home ŌŚÅ Standard Reporting ŌŚÅ Custom Reporting ŌŚÅ Admin ŌŚÅ Help
- 28. Reporting and Settings ŌŚÅ Dashboard/Home ŌŚÅ Standard Reporting ŌŚÅ Custom Reporting ŌŚÅ Admin ŌŚÅ Help
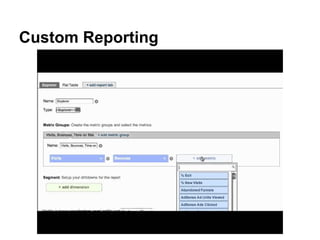
- 29. Custom Reporting A custom report is a report that you create. You pick the dimensions (City and Browser, for example) and metrics (Visits, Pageviews, and Bounce Rate, for example) and decide how they should be displayed.
- 30. Custom Reporting
- 31. Reporting and Settings ŌŚÅ Dashboard/Home ŌŚÅ Standard Reporting ŌŚÅ Custom Reporting ŌŚÅ Admin ŌŚÅ Help
- 32. Use the Admin Tab to: ŌŚÅ Add users ŌŚÅ Access your tracking code ŌŚÅ Add goals, filters, segments ŌŚÅ Set up custom alerts ŌŚÅ Schedule email updates
- 33. Reporting and Settings ŌŚÅ Dashboard/Home ŌŚÅ Standard Reporting ŌŚÅ Custom Reporting ŌŚÅ Admin ŌŚÅ Help
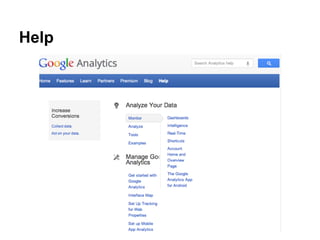
- 34. Help
- 35. Help ŌŚÅ Google Analytics provides a very comprehensive and up-to-date help section. Easy to navigate. ŌŚÅ YouTube is also a wealth of free video tutorials. *Be sure to check the date of the videos: you don't want to be learning from a 2-3 year old tutorial!
- 38. Key Email Marketing Metrics 1. Bounce Rate a. Soft Bounce: Server error or full inbox; message will eventually be received b. Hard Bounce: Undeliverable (bad email address) 2. Delivery Rate a. Indicator of a spam filter problem 3. Click Rate a. This tells you who your recipients are, and what they want from your emails in the future 4. Conversion Rate a. Rate of how many people completed an action b. This is the ultimate gauge as to how well your email performed
- 42. Social Media Analytics Insights -- How you can better plan and tailor your activity for the audience you're attempting to reach. Content Development -- Strategize your content and voice to meet your audience Measurement -- Identifying tools and resources to help you measure your reach and improve
- 43. Pinpoint -- #1 Don't Be Blind. 1. Understand your audience 2. Familiarize yourself with the culture and standards of the network: ŌŚŗ Information based vs Opinion/Thought based ŌŚŗ Regular "RTs" ŌŚŗ Conversational tone? ŌŚŗ Mentions, credit, and #FF? 3. Know the influential people within your network
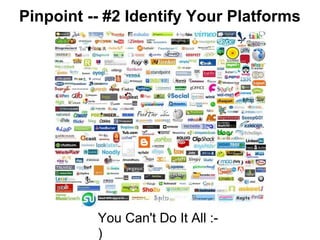
- 44. Pinpoint -- #2 Identify Your Platforms You Can't Do It All :- )
- 45. Pinpoint -- #3 Know Your Voice My Advice: Identify the main themes and topics that you plan to consistently talk about. Of those topics, 80% of your social media activity should convey YOUR BRAND.
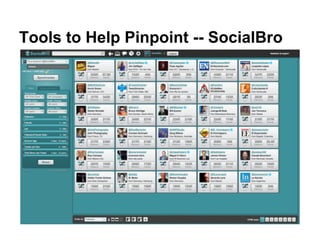
- 46. Tools to Help Pinpoint -- SocialBro
- 47. Preparation... ...isn't a one-time deal. It takes continued awareness and mindfulness about the voice, content, and personality that you're sharing with the world.
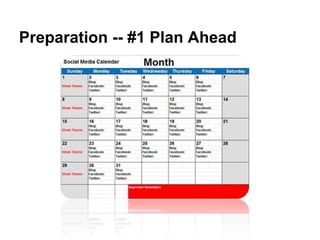
- 48. Preparation -- #1 Plan Ahead
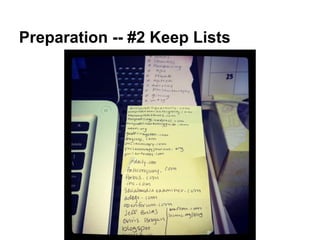
- 49. Preparation -- #2 Keep Lists
- 50. Preparation -- #3 Keep Current Don't be left in the dust by not knowing what's happening the world. Use email, blogs, news sites, journalists, and authoritative accounts to keep up with news in your industry.
- 51. Part III -- Perform
- 52. Perform -- Tip #1 Provide useful information that's related to your brand, company, work, expertise, interests, etc. Don't diverge too much - your followers may become confused or frustrated by your clutter.
- 53. Perform -- Tip #2 Post Regularly. Decide what's right for you and your audience. DO NOT: Post irregularly or rarely (less than once a week).
- 54. Perform -- Tip #3 Remember, everyone likes a laugh.
- 55. Perform -- Tip #4 Get people thinking. Provide insight. Spark a conversation. Make people feel good.
- 56. Perform -- Tip #5 Be helpful and responsive This tip applies to both individuals and companies - reply to mentions, answer questions -- BE SOCIAL
- 57. Putting It All Together -- How to Determine Your Success Want to stay relevant? Trusted? Useful? Use the following metrics to ensure that you stay on track:
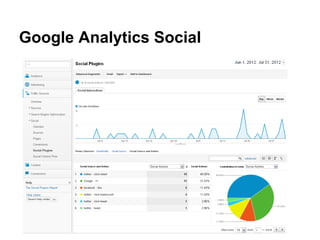
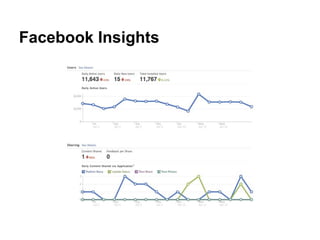
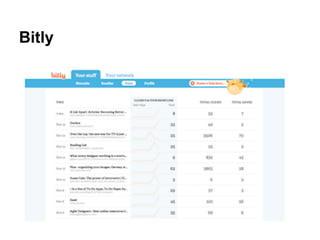
- 58. Here's the data that I care about... ŌŚÅ Click Count ŌŚÅ Mention & RT Count ŌŚÅ What links and topics are most engaging ŌŚÅ If day/time affected engagement ŌŚÅ Time spent on website ŌŚÅ Influencers who follow/mention/RT
- 59. Buffer (website & plugin/extension)
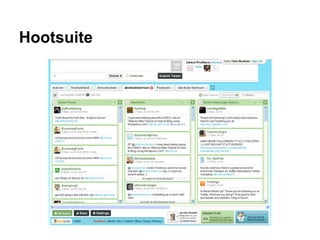
- 60. Hootsuite
- 63. Bitly
- 64. RECAP: Start : Understand your goals and purpose on social media. Know what platforms make sense (you can't do them all!). Make it Happen : Develop a voice, follow influential accounts, plan for regular posting. Measure : Know what's working and what isn't. Tweak and adjust (you'll have to often).
- 65. Pinpoint, Prepare, and Perform with Web Analytics Katie Vojtko Marketing Specialist, DonorPro by TowerCare Technologies kvojtko@towercare.com | towercare.com


