Presentation
- 1. Travel Time Estimation: An ITS Perspective Sunil Gyawali Tim
- 2. Outline ŌĆó Introduction ŌĆó Objective ŌĆó Methodology ŌĆó Collection of Information ŌĆó NDORŌĆÖs Sensors Deployment ŌĆó Travel Time based on Bluetooth Data ŌĆó Time Vs. Velocity Plot based on NDOR Sensor Data
- 3. Introduction Why Travel Time? ŌĆó To asses operational management and planning of network ’āśIndicator : LOS of road link ’āśParameter: Congestion ŌĆó As appreciated information for road users
- 4. Objective ŌĆó Compare literature based Travel Time estimation to the field measured Travel Time ŌĆó Develop models for predicting Travel Time and Congestion and assess their performance.
- 5. Methodology
- 6. Collection of Information (Day1)
- 7. Collection of Information (Day 2)
- 8. NDOR Sensors within the Study Segments
- 9. Travel Time based on Bluetooth Data
- 10. Time Vs. Velocity Plot based on NDOR Sensor Data 0.62 0.64 0.66 0.68 0.7 0.72 0.74 0.76 20 40 60 80 100 Time Velocity WB 114 Street 0.62 0.64 0.66 0.68 0.7 0.72 0.74 0.76 85 90 95 100 105 Time Velocity WB 156 Street 0.62 0.64 0.66 0.68 0.7 0.72 0.74 0.76 70 80 90 100 110 Time Velocity WB 144 Street 0.62 0.64 0.66 0.68 0.7 0.72 0.74 0.76 40 60 80 100 120 Time Velocity WB 132 Street 0.62 0.64 0.66 0.68 0.7 0.72 0.74 0.76 20 40 60 80 100 120 Time Velocity WB 127 Street 0.62 0.64 0.66 0.68 0.7 0.72 0.74 0.76 90 95 100 105 110 115 Time Velocity WB 204 Street 0.62 0.64 0.66 0.68 0.7 0.72 0.74 0.76 80 85 90 95 100 105 110 Time Velocity WB 192 Street 0.62 0.64 0.66 0.68 0.7 0.72 0.74 0.76 70 80 90 100 110 Time Velocity WB 168 Street 0.62 0.64 0.66 0.68 0.7 0.72 0.74 0.76 80 90 100 110 120 Time Velocity WB ON Ramp Light Pole 5PM-6PM Congestion
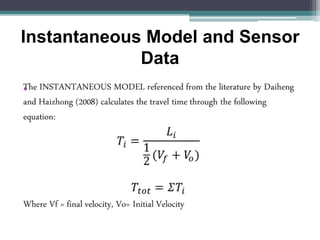
- 11. Instantaneous Model and Sensor Data ŌĆó
- 12. Travel Time (Bluetooth Data Vs. Instantaneous Model based on Sensor Data) Section RMS Subsection1 0.152 Subsection2 0.087 Whole Section 0.109
- 13. Multiple Linear Regression for Travel Time
- 14. Travel Time Model Performance
- 17. Findings from the Study ŌĆó The Travel Time estimated with Instantaneous Model validates with the Field Measured (Bluetooth based) Travel Time. ŌĆó The Travel Time is highly correlated with independent variables as velocities at beginning and end of the section, segment length, and the earlier travel time (5 minute before) as evident in multiple linear regression modeling. ŌĆó Similarly, the situation of the segment being congested or not is also explained by above mentioned variables along with number entry/exit points along the segment. ŌĆó Since from the Time Vs. Velocity plot, the congestion at the period 5 PM- 6 PM was seemingly high at the upstream


