Thank You Evernote+мғқмӮ°м„ұ _л„Ҳкөҙм–‘
5 likes664 views

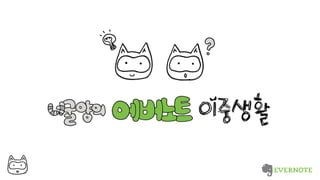
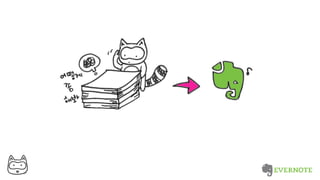
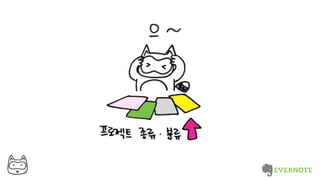
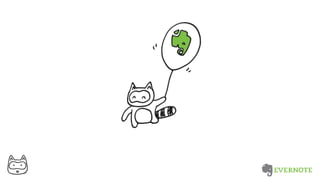
2015л…„ 3мӣ” 25мқј @нҷҚлҢҖ к°ҖнҶЁлҰӯмІӯл…„нҡҢкҙҖ Thank You Evernote+мғқмӮ°м„ұ н•ң мҠ¬лқјмқҙл“ңм—җ 15мҙҲм”© мһҗлҸҷмңјлЎң л„ҳм–ҙк°ҖлҠ” мқҙк·ёлӮҳмқҙнҠё л°©мӢқ л‘җ к°Җм§Җ м§Ғм—…мқ„ к°Җ진 л„Ҳкөҙм–‘мқҖ м–ҙл–»кІҢ м—җлІ„л…ёнҠёлҘј м“ёк№Ң? л…ёнҠёл¶Ғкіј мҠӨнғқмңјлЎң кҙҖлҰ¬к°Җ л¶ҖлӢҙмҠӨлҹ¬мӣҢ м§Ҳ л•Ң м“°лҠ” нғңк·ё нғңк·ён…Ңмқҙлё”мқ„ л§Ңл“Өм–ҙ лӮҳл§Ңмқҳ л°©мӢқмңјлЎң нғңк·ёлҘј кҙҖлҰ¬н•ҳмһҗ! нғңк·ёмҷҖ кІҖмғүлӘ©лЎқмқҙ мқјмІҳлҰ¬мҷҖ кІҖмғүмқ„ нҡЁмңЁм ҒмңјлЎң л§Ңл“Өм–ҙмӨҖлӢӨ мҠӨл§ҲнҠёмӣҢнҒ¬лҠ” 'мһҗмң 'лӢӨ!
1 of 20
Download to read offline


Ad
Recommended
лӮҳлқјмӢң(лӮҳлқјлҸ„ л°”кҫёлҠ” мӢңк°„ 18분)л°ңн‘ң 20141127
лӮҳлқјмӢң(лӮҳлқјлҸ„ л°”кҫёлҠ” мӢңк°„ 18분)л°ңн‘ң 20141127Heejeong Jung
Мэ
лӮҳлқјмӢң(лӮҳлқјлҸ„ л°”кҫёлҠ” мӢңк°„ 18분)л°ңн‘ң 20141127
к·ёлҰјмңјлЎң мһҗмң лЎӯкІҢ лӮҳлҘј н‘ңнҳ„н•ҳлқј!
'л°°мӣҢм„ң' 'мўӢмқҖ лҸ„кө¬лЎң' к·ёлҰ¬лҠ” кІғл§Ңмқҙ к·ёлҰјмқҙ м•„лӢҲлӢӨ
мғқнҷңмҶҚм—җм„ң л§ҲмЈјм№ҳлҠ” кІғл“Өм—җ лӢӨм–‘н•ң н‘ңм •мқ„ мһ…нһҲл©ҙ мӮ¶мқҙ лҚ” мҰҗкІҒкі к°җм •мқҙ лҚ” н’Қм„ұн•ҙм§ҖлҠ” кІҪн—ҳмқ„ н•ҙліҙмһҗ
лӮЁл“Өмқҙ к·ёлҰ° к·ёлҰјмқ„ ліҙлҠ” кІғм—җм„ң к·ём№ҳм§Җ л§җкі лӮҳл§Ңмқҳ н‘ңнҳ„мқ„ н•ҙліҙмһҗ
л„Ҳкөҙм–‘мқҳ к·ёлҰјмқјкё°м—җлІ„л…ёнҠё мӢ к·ңмӮ¬мҡ©мһҗ м„ёлҜёлӮҳ(20140918) <л„Ҳкөҙм–‘мқҳ>
м—җлІ„л…ёнҠё мӢ к·ңмӮ¬мҡ©мһҗ м„ёлҜёлӮҳ(20140918) <л„Ҳкөҙм–‘мқҳ>Heejeong Jung
Мэ
м—җлІ„л…ёнҠё мӢ к·ңмӮ¬мҡ©мһҗ м„ёлҜёлӮҳ(20140918)
<л„Ҳкөҙм–‘мқҳ>
мҡ°лҰ¬лҠ” мҷң кё°лЎқн•ҳлҠ”к°Җ?
м—җлІ„л…ёнҠёлЎң кё°м–ө/нҷңмҡ©/кіөмң лҘј мҰҗкё°мһҗ!
мғқнҷңмҶҚм—җм„ң м–ём ң м–ҙл””м„ңлӮҳ м“°лҠ” м—җлІ„л…ёнҠёлҘј л§Ңнҷ”лЎң мҶҢк°ңн•ңлӢӨ.
лӮҙ мӮ¶мқҳ мһ‘мқҖ лҸ„м„ңкҙҖ, м—җлІ„л…ёнҠёлЎң л§Ңл“Өмһҗ.
[м•Ўм…ҳмҠӨмҝЁ] л„Ҳкөҙм–‘ к·ёлҰјмңјлЎң мғқк°Ғн•ҳкі н‘ңнҳ„н•ҳкё°
[м•Ўм…ҳмҠӨмҝЁ] л„Ҳкөҙм–‘ к·ёлҰјмңјлЎң мғқк°Ғн•ҳкі н‘ңнҳ„н•ҳкё°Heejeong Jung
Мэ
л„Ҳкөҙм–‘мқҳ к·ёлҰјмңјлЎң мғқк°Ғн•ҳкі н‘ңнҳ„н•ҳкё°
м•Ўм…ҳмҠӨмҝЁ 2015л…„ 4мӣ” 18мқј нҶ мҡ”мқј к°•мқҳ @л§ҲмқҙнҒ¬мһ„нҢ©нҠё
мҷң к·ёлҰјмңјлЎң мғқк°Ғн•ҳкі н‘ңнҳ„н•ҳлҠ”к°Җ?
к·ёлҰјмқҙ м–ҙл өлӢӨ, мһҳн•ҙм•ј н•ңлӢӨлҠ” нҺёкІ¬мқ„ лІ„лҰ¬мһҗ
м–ҙл–»кІҢ к·ёлҰјмңјлЎң мғқк°Ғн•ҳкі н‘ңнҳ„н•ҳлҠ”м§Җ м•Ңм•„ліҙмһҗм—җлІ„л…ёнҠё мӢ к·ңмӮ¬мҡ©мһҗ м„ёлҜёлӮҳ л°ңн‘ңмһҗлЈҢ л„Ҳкөҙм–‘ 20140613
м—җлІ„л…ёнҠё мӢ к·ңмӮ¬мҡ©мһҗ м„ёлҜёлӮҳ л°ңн‘ңмһҗлЈҢ л„Ҳкөҙм–‘ 20140613Heejeong Jung
Мэ
м—җлІ„л…ёнҠё мӢ к·ңмӮ¬мҡ©мһҗ м„ёлҜёлӮҳм—җм„ң л°ңн‘ңн•ң мһҗлЈҢмһ…лӢҲлӢӨ~
'м•јл§Өмң м Җ' л„Ҳкөҙм–‘мқҙ м“°лҠ” мүҪкі мһ¬лҜёмһҲлҠ” м—җлІ„л…ёнҠё мӮ¬мҡ©лІ•мқ„ м•Ңл Өл“ңл Өмҡ” :D
<л„Ҳкөҙм–‘кіј> м—°мһ¬ мӨ‘! @м—җлІ„л…ёнҠё мҪ”лҰ¬м•„ нҺҳмқҙмҠӨл¶Ғ (http://www.facebook.com/evernote.kr 2015 CAU Campus CEO_Final_Team S.P.F.
2015 CAU Campus CEO_Final_Team S.P.F.SeungHwan Jung
Мэ
This document appears to be a business plan created by Team S.P.F. for an art commerce platform for undergraduates. It outlines sections on their problem statement, solution, target market, business model, and contact details for the team members. The document provides an overview of the different aspects of their business plan but does not go into detail about the content of each section.лүҙмҠӨм ӨлҰ¬ мқёнҸ¬к·ёлһҳн”Ҫ мҙқм •лҰ¬
лүҙмҠӨм ӨлҰ¬ мқёнҸ¬к·ёлһҳн”Ҫ мҙқм •лҰ¬Newsjelly
Мэ
Infomation + Graphic = Infographic !!
лӢӨм–‘н•ң лҚ°мқҙн„°мҷҖ м •ліҙлҘј н•ң лҲҲм—җ ліҙкё° мүҪлҸ„лЎқ л§Ңл“Өм–ҙмЈјлҠ”
мқёнҸ¬к·ёлһҳн”Ҫ!!
лҚ°мқҙн„° м Җл„җлҰ¬мҰҳм—җм„ң кјӯ н•„мҡ”н•ң кІғмқҙ л°”лЎң
лҚ°мқҙн„° мӢңк°Ғнҷ” нҲҙ, мқёнҸ¬к·ёлһҳн”Ҫмһ…лӢҲлӢӨ!
лүҙмҠӨм ӨлҰ¬к°Җ лӘЁм•„ліё мқёнҸ¬к·ёлһҳн”Ҫмқҳ мң нҳ• мҙқм •лҰ¬!!
1. мқёнҸ¬к·ёлһҳн”Ҫ
1) мҲ«мһҗ к°•мЎ°
2) м—°лҸ„ к°•мЎ°
3) к·ёлһҳн”„ к°•мЎ°
4) мҲңм„ң, л°©лІ• к°•мЎ°
5) мӮ¬м§„ к°•мЎ°
6) VS к°•мЎ°
2. мқён„°лһҷнӢ°лёҢ мқёнҸ¬к·ёлһҳн”Ҫ
3. лӘЁм…ҳ мқёнҸ¬к·ёлһҳн”Ҫ
лҚ°мқҙн„° м Җл„җлҰ¬мҰҳмқҳ мғҲ л°”лһҢ, лүҙмҠӨм ӨлҰ¬(Newsjelly)
http://newsjel.lyBig Data and Data Visualization(Inforgraphics) 2012л…„ KISTI(н•ңкөӯм •ліҙкіјн•ҷкё°мҲ м—°кө¬мӣҗ) л°ңн‘ң мһҗлЈҢ
Big Data and Data Visualization(Inforgraphics) 2012л…„ KISTI(н•ңкөӯм •ліҙкіјн•ҷкё°мҲ м—°кө¬мӣҗ) л°ңн‘ң мһҗлЈҢSeul Koo
Мэ
Presentation about Big Data and Data Visualization(Inforgraphics) at KISTI(Korea Institute of Science and Technology Information). Data Visualization Technology can analyze and find a hidden business opportunity through a systematic visualization tool for Big Data.Visual Journal examples
Visual Journal examplesFrank Curkovic
Мэ
A visual journal provides examples to help with creating journals. The examples are meant to inspire different visual styles and layouts for recording personal thoughts, experiences, and ideas through images and words. The resources in the journal are intended to be used for educational purposes.Beyond Usable | Mapping Emotion to Experience
Beyond Usable | Mapping Emotion to ExperienceKelly Goto
Мэ
The document explores the compulsive behaviors surrounding smartphone usage, revealing that individuals check their phones an average of 34 times daily in a habitual manner, often without conscious awareness. It discusses the implications of technology on cognitive processes and emotional engagement in product development, suggesting that emotional values should be integrated into design. Additionally, the text highlights the importance of understanding user experience beyond mere functionality to enhance meaningful connections with products.170326 м°Ҫм—… м§Җмӣҗ мӮ¬м—… мҶҢк°ң(мӮ¬м—…нҷ”В·м •мұ…мһҗкёҲ)
170326 м°Ҫм—… м§Җмӣҗ мӮ¬м—… мҶҢк°ң(мӮ¬м—…нҷ”В·м •мұ…мһҗкёҲ)SeungWon Lee
Мэ
2017л…„ м •л¶Җм§ҖмӣҗмһҗкёҲ мӮ¬м—…нҷ” л°Ҹ м •мұ…мһҗкёҲ лӘ©лЎқ
л§ӨмЈј 22:00м—җ м •л¶Җм§ҖмӣҗмһҗкёҲ м •ліҙлҘј м№ҙн…Ңкі лҰ¬лі„лЎң лӮҳлҲ м—…лЎңл“ң н•©лӢҲлӢӨ.к°ңл°ңмһҗлҘј мң„н•ң лҸ„нҠёл””мһҗмқёмһ…л¬ё(2017. 03, 09.)
к°ңл°ңмһҗлҘј мң„н•ң лҸ„нҠёл””мһҗмқёмһ…л¬ё(2017. 03, 09.)Yunjeong Kim
Мэ
мқҙм ң м„ңм җм—җм„ң мұ…мңјлЎң л§ҢлӮҳмҡ”. - л§Ңл“Өл©ҙм„ң л°°мҡ°лҠ” н”Ҫм…Җм•„нҠё(н•ңл№ӣлҜёл””м–ҙ)More Related Content
Viewers also liked (6)
Visual Journal examples
Visual Journal examplesFrank Curkovic
Мэ
A visual journal provides examples to help with creating journals. The examples are meant to inspire different visual styles and layouts for recording personal thoughts, experiences, and ideas through images and words. The resources in the journal are intended to be used for educational purposes.Beyond Usable | Mapping Emotion to Experience
Beyond Usable | Mapping Emotion to ExperienceKelly Goto
Мэ
The document explores the compulsive behaviors surrounding smartphone usage, revealing that individuals check their phones an average of 34 times daily in a habitual manner, often without conscious awareness. It discusses the implications of technology on cognitive processes and emotional engagement in product development, suggesting that emotional values should be integrated into design. Additionally, the text highlights the importance of understanding user experience beyond mere functionality to enhance meaningful connections with products.170326 м°Ҫм—… м§Җмӣҗ мӮ¬м—… мҶҢк°ң(мӮ¬м—…нҷ”В·м •мұ…мһҗкёҲ)
170326 м°Ҫм—… м§Җмӣҗ мӮ¬м—… мҶҢк°ң(мӮ¬м—…нҷ”В·м •мұ…мһҗкёҲ)SeungWon Lee
Мэ
2017л…„ м •л¶Җм§ҖмӣҗмһҗкёҲ мӮ¬м—…нҷ” л°Ҹ м •мұ…мһҗкёҲ лӘ©лЎқ
л§ӨмЈј 22:00м—җ м •л¶Җм§ҖмӣҗмһҗкёҲ м •ліҙлҘј м№ҙн…Ңкі лҰ¬лі„лЎң лӮҳлҲ м—…лЎңл“ң н•©лӢҲлӢӨ.к°ңл°ңмһҗлҘј мң„н•ң лҸ„нҠёл””мһҗмқёмһ…л¬ё(2017. 03, 09.)
к°ңл°ңмһҗлҘј мң„н•ң лҸ„нҠёл””мһҗмқёмһ…л¬ё(2017. 03, 09.)Yunjeong Kim
Мэ
мқҙм ң м„ңм җм—җм„ң мұ…мңјлЎң л§ҢлӮҳмҡ”. - л§Ңл“Өл©ҙм„ң л°°мҡ°лҠ” н”Ҫм…Җм•„нҠё(н•ңл№ӣлҜёл””м–ҙ)