ݺߣ

ݺߣShare a Scribd company logo
Wisinski of
West Michigan
Office • Industrial • Retail • Multi-Family
100 Grandville Ave SW Suite 100
Grand Rapids, MI 49503
616. 776. 0100 www.naiwwm.com
*Also serving the Kalamazoo & Southwest
Michigan areas from our new Kalamazoo office*
Retail Market Report
West Michigan Q4 - Year End 2015
LookingAheadattheRetail
MarketinSixteen.
For Retailers, Brands and
Consumers.
*	The information contained herein has been given to us by sources we deem reliable. We have
no reason to doubt its accuracy, however, we do not make any guarantees. All information
should be verified before relying thereon.
*	 Source: NAIWisinskiofWestMI, CoStar Property®
,  U.S. Bureau of Labor Statistics
GRAND RAPIDS, MI
The Market
2015 was an EXCITING year for retail real estate in West
Michigan. The market continues to absorb vacancy and
significant new projects have come on line. The most notable and
largest project is the 75 store Tanger Outlet center in Byron Center.
This was a long awaited dream for the throngs of outlet mall
shoppers. Look for continued development around Tanger
especially some food related brands. In Holland, de-malling began
on the now named Shops at West Shore along with outlot
construction. Kalamazoo saw a major new development off
Stadium Dr at US 131 with the opening of Costco and the regions
first Field  Stream scheduled to open in the first quarter of 2016.
Here are a few others who chose to locate in Grand Rapids in 2015:
Trader Joes, Fresh Market, West Elm, Wolfgang Puck, Slows BBQ,
Orvis, Jersey Mike’s Subs, Bravo, Pieology, Menchies Yogurt and
more. As we look forward to 2016 the pace for retail doesn’t show
any signs of slowing down. There is significant new
construction happening at Knapp  East Beltline with several new
names to be announced soon. The long awaited arrival of
Chick-fil-A is projected to occur this year and our area’s first
Freddy’s Frozen Custard  Steakburgers is under construction on
Plainfield NE. If you’re already a retailer in Grand Rapids, please
contact our NAI Retail Team to learn how we can assist you with
mapping out and securing your new or next location. If you’re
wondering if your company should open a store in West
Michigan…the time is now! Anyone on our Retail Team would be
happy to discuss the West Michigan marketplace in further detail.
Please contact us. Have a great 2016!
-Rod Alderink,
Principal | NAI Member
“Our West Michigan
economy continues to
receive accolades as one of
the fastest growing in the
country ranked in similar
company with Houston and
Denver. Our unemployment
continues to be the lowest
in the state and below the
national average. Grand
Rapids is no longer seen
as an in-fill location after
retailers have ventured
to Chicago and Detroit.
Wisconsin based Kessler
Jewlery chose Grand
Rapids for its first out-state
location.”
Construction Trends Across the US
0
10
20
30
40
50
60
70
80
90
1993 1996 1999 2002 2005 2008 2011 2014
$Billions
0
10
20
30
40
50
60
70
1993 1996 1999 2002 2005 2008 2011 2014
$Billions
0
20
40
60
80
100
120
1993 1996 1999 2002 2005 2008 2011 2014
$Billions
A New High and Soaring
10
20
30
40
50
60
70
80
90
1993 1996 1999 2002 2005 2008 2011 2014
$Billions
Well Below Average
0
500
1,000
1,500
2,000
2,500
3,000
3,500
4,000
4,500
5,000
2004 2005 2006 2007 2008 2009 2010 2011 2012 2013
Total, All Structure Types Single Family Houses
Source: Census Housing Starts. -to-date, Oct 2015
2014 2015*
West Michigan
Retail Submarket Statistics
Retail Statistical Changes Year-over-Year and Quarter-over-Quarter
CONSTRUCTION
CONSTRUCTION
ASKING RATES
ASKING RATES
VACANCY RATE
VACANCY RATE
NET ABSORPTION
NET ABSORPTION
3Q15vs. 4Q15
4Q14 vs. 4Q15
2015 Q4 Retail Snapshot
Submarket Total RBA
Vacant
Available SF
Vacancy
Rate
Total Average
NNN Rate
($/SF/Yr)
Total Net
Absorption (SF)
Lakeshore
Community 1,465,132 90,031 6.1% $8.16 3,512
Neighborhood 1,465,132 90,031 6.1% $7.96 3,512
Strip 1,022,191 97,080 9.5% $9.64 -554
Total 3,952,454 277,142 7.0% $8.59 6,470
Northeast
Community 445,573 160,256 3.6% $4.89 -
Neighborhood 1,094,518 118,000 10.8% $10.57 3,681
Strip 680,347 66,508 9.8% $9.96 -2,950
Total 2,220,438 344,764 15.5% $8.47 731
Northwest
Community 863,186 32,718 3.8% $12.00 6,975
Neighborhood 1,094,518 118,000 10.8% $10.57 3,681
Strip 531,191 64,690 12.2% $9.94 15,420
Total 2,488,895 215,408 8.7% $10.84 26,076
Southeast
Community 744,146 15,815 2.1% $20.81 860
Neighborhood 2,468,589 436,857 17.7% $10.26 8,800
Strip 1,717,517 147,520 8.6% $9.98 13,503
Total 4,930,252 600,192 12.2% $13.69 23,163
Southwest
Community 1,651,066 230,596 14.0% $10.60 2,800
Neighborhood 966,819 136,904 14.2% $7.96 2,194
Strip 948,325 68,189 7.2% $9.53 3,150
Total 3,566,210 435,689 12.2% $9.36 8,144
Overall Total 17,158,249 1,873,195 10.9% $10.19 64,584
Retail Total Market Report
0.00%
5.00%
10.00%
15.00%
20.00%
2011 2012 2013 2014 2015
Vacancy Rate Across All Submarkets
Vacancy Rates- Neighborhood Vacancy Rates- Community Vacancy Rates- Strip
$0.00
$2.00
$4.00
$6.00
$8.00
$10.00
$12.00
2011 2012 2013 2014 2015
Triple Net Rental Rate
Rental Rates- Neighborhod Rental Rates- Community Rental Rates- Strip
0
5000
10000
15000
20000
2011 2012 20132 0142 015
-100,000
0
100,000
200,000
2011 2012 20132 014 2015
RBA Delivered Neighborhood RBA Delivered Community RBA Delivered Strip
2
2 2
$0.00
$2.00
$4.00
$6.00
$8.00
$10.00
$12.00
2011 2012 2013 2014 2015
Triple Net Rental Rate
Rental Rates- Neighborhod Rental Rates- Community Rental Rates- Strip
$0.00
$2.00
$4.00
$6.00
$8.00
$10.00
$12.00
2011 2012 2013 2014 2015
Triple Net Rental Rate
Rental Rates- Neighborhod Rental Rates- Community Rental Rates- Strip
$0.00
$2.00
$4.00
$6.00
$8.00
$10.00
$12.00
2011 2012 2013 2014 2015
Triple Net Rental Rate
Rental Rates- Neighborhod Rental Rates- Community Rental Rates- Strip
0
5,000
10,000
15,000
20,000
Methodology | Definitions | Submarket Map
Community Center
A shopping center development that has a total
square footage between 10,000 - 350,000 SF.
Generally will have 2-3 large anchored tenants,
but not department store anchors. Community
Center typically offers a wider range of apparel
and other soft goofs than the Neighborhood
Center. Among the more common anchors are
supermarkets and super drugstores.
Strip Center
A strip center is an attached row of stores or
service outlets managed as a coherent retail
entity, with on-site parking usually located in
front of the stores. Open canopies may connect
the storefronts, but a strip center does not have
enclosed walkways linking the stores.
Neighborhood Center
Provides for the sale of convenience goods (food,
drugs, etc) and personal services (laundry, dry
cleaning, etc.)
Absorption (Net)
The change in occupied space in a given
time period.
Available Square Footage
Net rentable area considered available for lease;
excludes sublease space.
Average Asking Rental Rate
Rental rate as quoted from each building’s
owner/management company. For retail, a triple
net rate is requested.
RBA
The total square footage of a building that can
be occupied by, or assigned to a tenant for
the purpose of determining a tenant’s rental
obligation.
Deliveries
Buildings that have their certificate of
occupancy and are allowed to be moved into by
the tenant/purchaser.
Vacancy Rate
All physically unoccupied lease space, either
direct or sublease.
SF/PSF
Square foot/per square foot, used as a unit of
measurement.
Southwest
Northeast
Southeast
Northwest
Lakeshore
Methodology:The retail market report includes community, neighborhood, and strip
retail buildings within each of the defined submarkets. For definition of product type,
please see below.
Through our affiliation with NAI Global, we can also assist you with your needs throughout the US  globally
right here from West Michigan.
Doug Taatjes, CCIM, SIOR
616 292 1828
dougt@naiwwm.com
Hillary Taatjes-Woznick
616 242 1113
hillaryt@naiwwm.com
Tim Platt
616 575 7031
timp@naiwwm.com
Gary Steere
616 575 7008
garys@naiwwm.com
Russ Bono
616 242 1115
russb@naiwwm.com
Jeremy Veenstra
616 242 1105
jeremyv@naiwwm.com
Marc Tourangeau
269 207 3072
markt@naiwwm.com
Stanley Wisinski III, SIOR, CCIM
616 575 7015
sjw@naiwwm.com
Bill Tyson
616 242 1103
billt@naiwwm.com
Meet Our Team
Retail Specialists
Rod Alderink
616 242 1104
roda@naiwwm.com
Dane Davis
269 459 0434
daned@naiwwm.com
Dick Jasinski
616 575 7003
dickj@naiwwm.com
Scott Nurski
616 242 1106
scottn@naiwwm.com
In the spring of 2011, two successful and reputable companies, The Wisinski Group and NAI West Michigan
merged. The merger represents collaboration, rich traditions, innovative technologies, unique cultures and
diversity of skills and specialties which ultimately benefit our clients. We’re going back to our fundamentals,
strengthening our core, and becoming stronger in the services we provide our clients. Our focus is simple,
building client relationships for life by offering market appropriate advice and then executing. Our success is
a direct result of its unwavering commitment to providing the best possible service to each and every client.
Our Brokers, with their 562 plus years of combined experience (20.1 years average), possess the knowledge
and expertise to manage the most complex transactions in industrial, office, retail, and multifamily specialities
throughout West Michigan.
NAI Wisinski of West Michigan
At a Glance
Achieve More.
Local Knowledge. Global Reach.
100 Grandville Ave SW Suite 100
Grand Rapids, MI 49503
616. 776. 0100 www.naiwwm.com
facebook.com/naiwwm
@naiwwm
nai-wisinski-of-west-michigan
Wisinski of
West Michigan
Office • Industrial • Retail • Multi-Family

More Related Content

Viewers also liked (12)

PDF
Market Report 2016 Q2 Industrial FINAL AS
Allison Seeley
PDF
FIC Financial Counseling Poster
Josey Herrera
PDF
Office Spotlight 2016
Allison Seeley
PDF
FIC Mental Health Clinic Poster
Josey Herrera
PPTX
Webcast: How To Create A Culture For Product Excellence At Your Company
AIPMM Administration
PDF
Not what you think insights from getting a golf product to market
AIPMM Administration
PPTX
Ley organica de educacion intercultural.
Pamelita Monita
PDF
Unidad III generacion de variables aleatorias
Anel Sosa
PPT
Fish for all: role of biotechnology in improving nutrition
ExternalEvents
PDF
Nmims distance learning courses
yunus khan
PPTX
Fisika inti dan radioaktif
Brawijaya University
Market Report 2016 Q2 Industrial FINAL AS
Allison Seeley
FIC Financial Counseling Poster
Josey Herrera
Office Spotlight 2016
Allison Seeley
FIC Mental Health Clinic Poster
Josey Herrera
Webcast: How To Create A Culture For Product Excellence At Your Company
AIPMM Administration
Not what you think insights from getting a golf product to market
AIPMM Administration
Ley organica de educacion intercultural.
Pamelita Monita
Unidad III generacion de variables aleatorias
Anel Sosa
Fish for all: role of biotechnology in improving nutrition
ExternalEvents
Nmims distance learning courses
yunus khan
Fisika inti dan radioaktif
Brawijaya University

Similar to Market Report 2015-Retail Q4 (20)

PDF
FINALQ4Retail 2016
Allison Seeley
PDF
Market Report 2016-Retail Q2 Final AS
Allison Seeley
PDF
Market Report 2016-Retail Q1
Allison Seeley
PDF
Market Report 2016-Retail Q3
Allison Seeley
PDF
FINAL Q4 Office
Allison Seeley
PDF
GRMarket Report Q2 2016 Office FINAL AS
Allison Seeley
PDF
convenience store business plan example
ECorp
PDF
Cfo outlook 2016
Ihab Ahmed Atwah, CMA, CFM
PDF
web-11_5872-imagine-magazine-issue-13-october-2015
Sarah Wallace
PDF
Imagine Magazine Issue 13
Nigel Wright Group
PDF
AutoZone - Sacramento, CA MSA - Absolute NNN
NealHamou
PDF
1405 1450 track1-waite
Rising Media, Inc.
PPTX
Agricultural show attendees email list (august 2019 )
Global B2B Contacts LLC
PPTX
Testing
eshim321
PDF
Utah DMC Presents: Let's Talk eCommerce - October 2019
Utah Digital Marketing Collective
PDF
wal mart store 2000Annual Report
finance1
PDF
Nielsen - Vietnam pocket reference 2013
★ Duong Vo ★
PDF
Nielsen - Vietnam Pocket Reference Book Low 2013
SAGE Brand and Communications Academy
PDF
Market Report Q4 2015 office
Allison Seeley
DOCX
MyTownCryer July, 2010
Tom Cryer
FINALQ4Retail 2016
Allison Seeley
Market Report 2016-Retail Q2 Final AS
Allison Seeley
Market Report 2016-Retail Q1
Allison Seeley
Market Report 2016-Retail Q3
Allison Seeley
FINAL Q4 Office
Allison Seeley
GRMarket Report Q2 2016 Office FINAL AS
Allison Seeley
convenience store business plan example
ECorp
web-11_5872-imagine-magazine-issue-13-october-2015
Sarah Wallace
Imagine Magazine Issue 13
Nigel Wright Group
AutoZone - Sacramento, CA MSA - Absolute NNN
NealHamou
1405 1450 track1-waite
Rising Media, Inc.
Agricultural show attendees email list (august 2019 )
Global B2B Contacts LLC
Testing
eshim321
Utah DMC Presents: Let's Talk eCommerce - October 2019
Utah Digital Marketing Collective
wal mart store 2000Annual Report
finance1
Nielsen - Vietnam pocket reference 2013
★ Duong Vo ★
Nielsen - Vietnam Pocket Reference Book Low 2013
SAGE Brand and Communications Academy
Market Report Q4 2015 office
Allison Seeley
MyTownCryer July, 2010
Tom Cryer
Ad

More from Allison Seeley (16)

PDF
Market Report Comprehensive Q4-Year End
Allison Seeley
PDF
Market Report 2016 Q4 Industrial FINAL
Allison Seeley
PDF
GRBJHoliday Ad
Allison Seeley
PDF
Corporate Overview- 2016 AS
Allison Seeley
PDF
NAI Case Study Option1_1col 2
Allison Seeley
PDF
Industrial Spotlight 2016 FINAL 10.13.16
Allison Seeley
PDF
GRBJ October Ad
Allison Seeley
PDF
Market Report 2016 Q3 Industrial
Allison Seeley
PDF
Market Report Q3 2016 Office
Allison Seeley
PDF
Market Report 2016 Q1 Industrial Final
Allison Seeley
PDF
Market Report Q1 2016 Office
Allison Seeley
PDF
Q4-Kzoo Overall Market Report
Allison Seeley
PDF
Market Report 2015-Industrial Q4
Allison Seeley
PDF
Market Report 2015-Industrial Q3
Allison Seeley
PDF
Market Report 2015 Office Q3
Allison Seeley
Market Report Comprehensive Q4-Year End
Allison Seeley
Market Report 2016 Q4 Industrial FINAL
Allison Seeley
GRBJHoliday Ad
Allison Seeley
Corporate Overview- 2016 AS
Allison Seeley
NAI Case Study Option1_1col 2
Allison Seeley
Industrial Spotlight 2016 FINAL 10.13.16
Allison Seeley
GRBJ October Ad
Allison Seeley
Market Report 2016 Q3 Industrial
Allison Seeley
Market Report Q3 2016 Office
Allison Seeley
Market Report 2016 Q1 Industrial Final
Allison Seeley
Market Report Q1 2016 Office
Allison Seeley
Q4-Kzoo Overall Market Report
Allison Seeley
Market Report 2015-Industrial Q4
Allison Seeley
Market Report 2015-Industrial Q3
Allison Seeley
Market Report 2015 Office Q3
Allison Seeley
Ad

Market Report 2015-Retail Q4

  • 1. Wisinski of West Michigan Office • Industrial • Retail • Multi-Family 100 Grandville Ave SW Suite 100 Grand Rapids, MI 49503 616. 776. 0100 www.naiwwm.com *Also serving the Kalamazoo & Southwest Michigan areas from our new Kalamazoo office* Retail Market Report West Michigan Q4 - Year End 2015
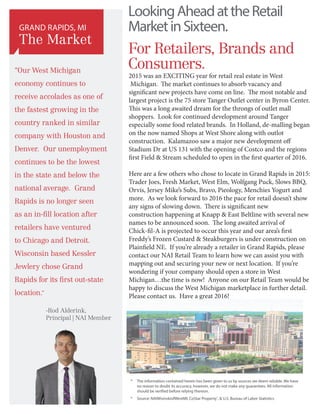
  • 2. LookingAheadattheRetail MarketinSixteen. For Retailers, Brands and Consumers. * The information contained herein has been given to us by sources we deem reliable. We have no reason to doubt its accuracy, however, we do not make any guarantees. All information should be verified before relying thereon. * Source: NAIWisinskiofWestMI, CoStar Property® , U.S. Bureau of Labor Statistics GRAND RAPIDS, MI The Market 2015 was an EXCITING year for retail real estate in West Michigan. The market continues to absorb vacancy and significant new projects have come on line. The most notable and largest project is the 75 store Tanger Outlet center in Byron Center. This was a long awaited dream for the throngs of outlet mall shoppers. Look for continued development around Tanger especially some food related brands. In Holland, de-malling began on the now named Shops at West Shore along with outlot construction. Kalamazoo saw a major new development off Stadium Dr at US 131 with the opening of Costco and the regions first Field Stream scheduled to open in the first quarter of 2016. Here are a few others who chose to locate in Grand Rapids in 2015: Trader Joes, Fresh Market, West Elm, Wolfgang Puck, Slows BBQ, Orvis, Jersey Mike’s Subs, Bravo, Pieology, Menchies Yogurt and more. As we look forward to 2016 the pace for retail doesn’t show any signs of slowing down. There is significant new construction happening at Knapp East Beltline with several new names to be announced soon. The long awaited arrival of Chick-fil-A is projected to occur this year and our area’s first Freddy’s Frozen Custard Steakburgers is under construction on Plainfield NE. If you’re already a retailer in Grand Rapids, please contact our NAI Retail Team to learn how we can assist you with mapping out and securing your new or next location. If you’re wondering if your company should open a store in West Michigan…the time is now! Anyone on our Retail Team would be happy to discuss the West Michigan marketplace in further detail. Please contact us. Have a great 2016! -Rod Alderink, Principal | NAI Member “Our West Michigan economy continues to receive accolades as one of the fastest growing in the country ranked in similar company with Houston and Denver. Our unemployment continues to be the lowest in the state and below the national average. Grand Rapids is no longer seen as an in-fill location after retailers have ventured to Chicago and Detroit. Wisconsin based Kessler Jewlery chose Grand Rapids for its first out-state location.”
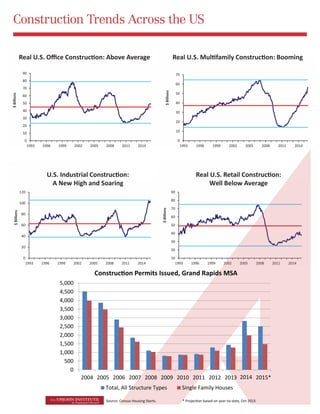
  • 3. Construction Trends Across the US 0 10 20 30 40 50 60 70 80 90 1993 1996 1999 2002 2005 2008 2011 2014 $Billions 0 10 20 30 40 50 60 70 1993 1996 1999 2002 2005 2008 2011 2014 $Billions 0 20 40 60 80 100 120 1993 1996 1999 2002 2005 2008 2011 2014 $Billions A New High and Soaring 10 20 30 40 50 60 70 80 90 1993 1996 1999 2002 2005 2008 2011 2014 $Billions Well Below Average 0 500 1,000 1,500 2,000 2,500 3,000 3,500 4,000 4,500 5,000 2004 2005 2006 2007 2008 2009 2010 2011 2012 2013 Total, All Structure Types Single Family Houses Source: Census Housing Starts. -to-date, Oct 2015 2014 2015*
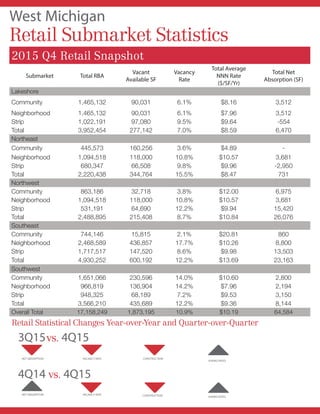
  • 4. West Michigan Retail Submarket Statistics Retail Statistical Changes Year-over-Year and Quarter-over-Quarter CONSTRUCTION CONSTRUCTION ASKING RATES ASKING RATES VACANCY RATE VACANCY RATE NET ABSORPTION NET ABSORPTION 3Q15vs. 4Q15 4Q14 vs. 4Q15 2015 Q4 Retail Snapshot Submarket Total RBA Vacant Available SF Vacancy Rate Total Average NNN Rate ($/SF/Yr) Total Net Absorption (SF) Lakeshore Community 1,465,132 90,031 6.1% $8.16 3,512 Neighborhood 1,465,132 90,031 6.1% $7.96 3,512 Strip 1,022,191 97,080 9.5% $9.64 -554 Total 3,952,454 277,142 7.0% $8.59 6,470 Northeast Community 445,573 160,256 3.6% $4.89 - Neighborhood 1,094,518 118,000 10.8% $10.57 3,681 Strip 680,347 66,508 9.8% $9.96 -2,950 Total 2,220,438 344,764 15.5% $8.47 731 Northwest Community 863,186 32,718 3.8% $12.00 6,975 Neighborhood 1,094,518 118,000 10.8% $10.57 3,681 Strip 531,191 64,690 12.2% $9.94 15,420 Total 2,488,895 215,408 8.7% $10.84 26,076 Southeast Community 744,146 15,815 2.1% $20.81 860 Neighborhood 2,468,589 436,857 17.7% $10.26 8,800 Strip 1,717,517 147,520 8.6% $9.98 13,503 Total 4,930,252 600,192 12.2% $13.69 23,163 Southwest Community 1,651,066 230,596 14.0% $10.60 2,800 Neighborhood 966,819 136,904 14.2% $7.96 2,194 Strip 948,325 68,189 7.2% $9.53 3,150 Total 3,566,210 435,689 12.2% $9.36 8,144 Overall Total 17,158,249 1,873,195 10.9% $10.19 64,584
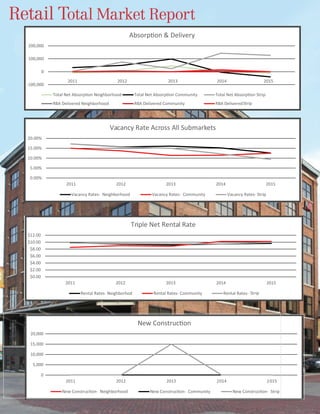
  • 5. Retail Total Market Report 0.00% 5.00% 10.00% 15.00% 20.00% 2011 2012 2013 2014 2015 Vacancy Rate Across All Submarkets Vacancy Rates- Neighborhood Vacancy Rates- Community Vacancy Rates- Strip $0.00 $2.00 $4.00 $6.00 $8.00 $10.00 $12.00 2011 2012 2013 2014 2015 Triple Net Rental Rate Rental Rates- Neighborhod Rental Rates- Community Rental Rates- Strip 0 5000 10000 15000 20000 2011 2012 20132 0142 015 -100,000 0 100,000 200,000 2011 2012 20132 014 2015 RBA Delivered Neighborhood RBA Delivered Community RBA Delivered Strip 2 2 2 $0.00 $2.00 $4.00 $6.00 $8.00 $10.00 $12.00 2011 2012 2013 2014 2015 Triple Net Rental Rate Rental Rates- Neighborhod Rental Rates- Community Rental Rates- Strip $0.00 $2.00 $4.00 $6.00 $8.00 $10.00 $12.00 2011 2012 2013 2014 2015 Triple Net Rental Rate Rental Rates- Neighborhod Rental Rates- Community Rental Rates- Strip $0.00 $2.00 $4.00 $6.00 $8.00 $10.00 $12.00 2011 2012 2013 2014 2015 Triple Net Rental Rate Rental Rates- Neighborhod Rental Rates- Community Rental Rates- Strip 0 5,000 10,000 15,000 20,000
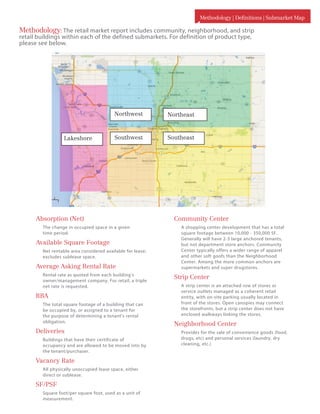
  • 6. Methodology | Definitions | Submarket Map Community Center A shopping center development that has a total square footage between 10,000 - 350,000 SF. Generally will have 2-3 large anchored tenants, but not department store anchors. Community Center typically offers a wider range of apparel and other soft goofs than the Neighborhood Center. Among the more common anchors are supermarkets and super drugstores. Strip Center A strip center is an attached row of stores or service outlets managed as a coherent retail entity, with on-site parking usually located in front of the stores. Open canopies may connect the storefronts, but a strip center does not have enclosed walkways linking the stores. Neighborhood Center Provides for the sale of convenience goods (food, drugs, etc) and personal services (laundry, dry cleaning, etc.) Absorption (Net) The change in occupied space in a given time period. Available Square Footage Net rentable area considered available for lease; excludes sublease space. Average Asking Rental Rate Rental rate as quoted from each building’s owner/management company. For retail, a triple net rate is requested. RBA The total square footage of a building that can be occupied by, or assigned to a tenant for the purpose of determining a tenant’s rental obligation. Deliveries Buildings that have their certificate of occupancy and are allowed to be moved into by the tenant/purchaser. Vacancy Rate All physically unoccupied lease space, either direct or sublease. SF/PSF Square foot/per square foot, used as a unit of measurement. Southwest Northeast Southeast Northwest Lakeshore Methodology:The retail market report includes community, neighborhood, and strip retail buildings within each of the defined submarkets. For definition of product type, please see below.
  • 7. Through our affiliation with NAI Global, we can also assist you with your needs throughout the US globally right here from West Michigan. Doug Taatjes, CCIM, SIOR 616 292 1828 dougt@naiwwm.com Hillary Taatjes-Woznick 616 242 1113 hillaryt@naiwwm.com Tim Platt 616 575 7031 timp@naiwwm.com Gary Steere 616 575 7008 garys@naiwwm.com Russ Bono 616 242 1115 russb@naiwwm.com Jeremy Veenstra 616 242 1105 jeremyv@naiwwm.com Marc Tourangeau 269 207 3072 markt@naiwwm.com Stanley Wisinski III, SIOR, CCIM 616 575 7015 sjw@naiwwm.com Bill Tyson 616 242 1103 billt@naiwwm.com Meet Our Team Retail Specialists Rod Alderink 616 242 1104 roda@naiwwm.com Dane Davis 269 459 0434 daned@naiwwm.com Dick Jasinski 616 575 7003 dickj@naiwwm.com Scott Nurski 616 242 1106 scottn@naiwwm.com In the spring of 2011, two successful and reputable companies, The Wisinski Group and NAI West Michigan merged. The merger represents collaboration, rich traditions, innovative technologies, unique cultures and diversity of skills and specialties which ultimately benefit our clients. We’re going back to our fundamentals, strengthening our core, and becoming stronger in the services we provide our clients. Our focus is simple, building client relationships for life by offering market appropriate advice and then executing. Our success is a direct result of its unwavering commitment to providing the best possible service to each and every client. Our Brokers, with their 562 plus years of combined experience (20.1 years average), possess the knowledge and expertise to manage the most complex transactions in industrial, office, retail, and multifamily specialities throughout West Michigan. NAI Wisinski of West Michigan At a Glance Achieve More. Local Knowledge. Global Reach.
  • 8. 100 Grandville Ave SW Suite 100 Grand Rapids, MI 49503 616. 776. 0100 www.naiwwm.com facebook.com/naiwwm @naiwwm nai-wisinski-of-west-michigan Wisinski of West Michigan Office • Industrial • Retail • Multi-Family