What is Pie chart
- 2. PIE CHART PREPARED BY AFRASIYAB ROLL NO B-02 BS BOTANY 4TH SEMESTER
- 3. WHO USED PIE CHART FIRSTLY?A pie chart is used by statistician William Playfair,s in 1801 for the first time. He used a pie chart for dipicting proportion of the Turkish empire located in Asia and Europe.
- 4. DEFINITION OF PIAE CHART A pie chart is circular drawing that is divided in to segment, with each segment representing data category or group.
- 5. TOOL USED TO DRAW A PIE CHART 1 PARCAR • USED TO DRAW CIRCLE 2 FOOT • USED TO DRAW LINE
- 6. 3 D FOOT • USED TO FIND ANGLE 4 PENCIL • FOR WRITING
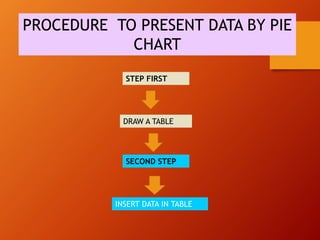
- 7. PROCEDURE TO PRESENT DATA BY PIE CHART STEP FIRST DRAW A TABLE SECOND STEP INSERT DATA IN TABLE
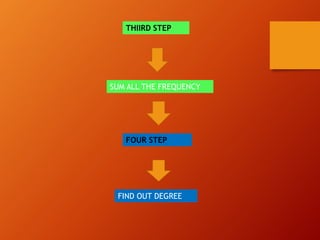
- 8. THIIRD STEP SUM ALL THE FREQUENCY FOUR STEP FIND OUT DEGREE
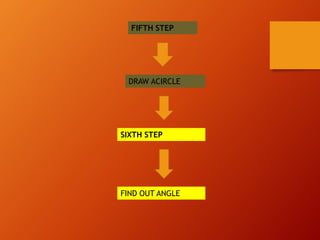
- 9. FIFTH STEP DRAW ACIRCLE SIXTH STEP FIND OUT ANGLE
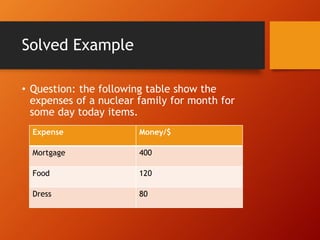
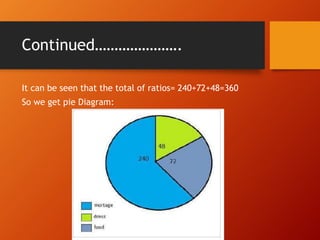
- 10. Solved Example • Question: the following table show the expenses of a nuclear family for month for some day today items. Expense Money/$ Mortgage 400 Food 120 Dress 80
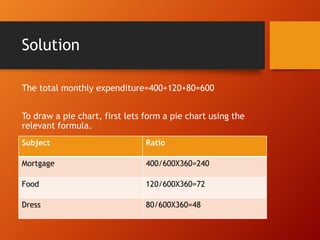
- 11. Solution The total monthly expenditure=400+120+80=600 To draw a pie chart, first lets form a pie chart using the relevant formula. Subject Ratio Mortgage 400/600X360=240 Food 120/600X360=72 Dress 80/600X360=48
- 12. Continued…………………. It can be seen that the total of ratios= 240+72+48=360 So we get pie Diagram:
- 13. References • www.google.com • www.Wikipedia.com • www.slideshare.net • Math.tutorvista.com
- 14. . THE END

