Capabilities Brief Analytics
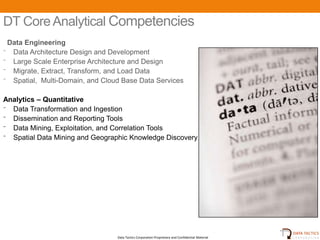
- 1. DT Core Analytical Competencies Data Engineering тБ╗ Data Architecture Design and Development тБ╗ Large Scale Enterprise Architecture and Design тБ╗ Migrate, Extract, Transform, and Load Data тБ╗ Spatial, Multi-Domain, and Cloud Base Data Services Analytics тАУ Quantitative тБ╗ Data Transformation and Ingestion тБ╗ Dissemination and Reporting Tools тБ╗ Data Mining, Exploitation, and Correlation Tools тБ╗ Spatial Data Mining and Geographic Knowledge Discovery Data Tactics Corporation Proprietary and Confidential Material
- 2. DT Core Analytical Competencies The Team: Graduates of top tier universities to include Stanford, Caltech and MIT as well as ties to these and local universities. Degrees include Mathematics, Computer Science, Aeronautical Engineering, Astrophysics, Electrical Engineering, Mechanical Engineering, Statistics and Social Sciences. Competencies include data mining, machine learning, statistics, spatial statistics, Bayesian statistics, econometrics, computational geometry, spatial econometrics, applied mathematics, theoretical robotics, dynamic systems, control theory. Foci include unsupervised cross-modal clustering algorithms, principle component analysis, independent component analysis, regression, spatial regression, geographic weighted regression, zeroth order processing, nonlinear optimization, autoregressive models, time-series analysis, spatial regime models, HAC models. Technical Competencies include Data Tactics Corporation Proprietary and Confidential Material
- 3. Data Tactics Analytics Cell Data Tactics Corporation Proprietary and Confidential Material
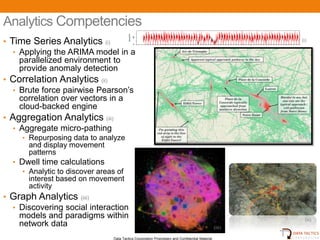
- 4. Analytics Competencies ZeroFill 40 тАв Time Series Analytics (i) (i) 0 тАв Applying the ARIMA model in a 02-13 Index parallelized environment to provide anomaly detection тАв Correlation Analytics (ii) тАв Brute force pairwise PearsonтАЯs correlation over vectors in a cloud-backed engine тАв Aggregation Analytics (iii) тАв Aggregate micro-pathing тАв Repurposing data to analyze (ii) and display movement patterns тАв Dwell time calculations тАв Analytic to discover areas of interest based on movement activity тАв Graph Analytics (iiii) тАв Discovering social interaction models and paradigms within (iii) network data (iiii) 4 Data Tactics Corporation Proprietary and Confidential Material
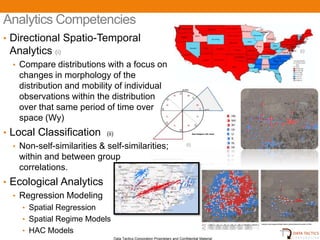
- 5. Analytics Competencies тАв Directional Spatio-Temporal Analytics (i) (i) тАв Compare distributions with a focus on changes in morphology of the distribution and mobility of individual observations within the distribution over that same period of time over space (Wy) тАв Local Classification (ii) тАв Non-self-similarities & self-similarities; (i) within and between group correlations. тАв Ecological Analytics (ii) тАв Regression Modeling тАв Spatial Regression тАв Spatial Regime Models тАв HAC Models 5 Data Tactics Corporation Proprietary and Confidential Material
- 6. Data Tactics Data Repository Data Tactics Corporation Proprietary and Confidential Material
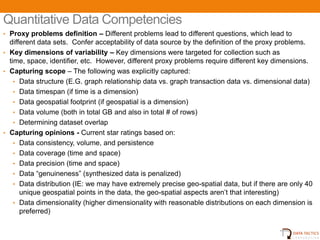
- 7. Quantitative Data Competencies тАв Proxy problems definition тАУ Different problems lead to different questions, which lead to different data sets. Confer acceptability of data source by the definition of the proxy problems. тАв Key dimensions of variability тАУ Key dimensions were targeted for collection such as time, space, identifier, etc. However, different proxy problems require different key dimensions. тАв Capturing scope тАУ The following was explicitly captured: тАв Data structure (E.G. graph relationship data vs. graph transaction data vs. dimensional data) тАв Data timespan (if time is a dimension) тАв Data geospatial footprint (if geospatial is a dimension) тАв Data volume (both in total GB and also in total # of rows) тАв Determining dataset overlap тАв Capturing opinions - Current star ratings based on: тАв Data consistency, volume, and persistence тАв Data coverage (time and space) тАв Data precision (time and space) тАв Data тАЬgenuinenessтАЭ (synthesized data is penalized) тАв Data distribution (IE: we may have extremely precise geo-spatial data, but if there are only 40 unique geospatial points in the data, the geo-spatial aspects arenтАЯt that interesting) тАв Data dimensionality (higher dimensionality with reasonable distributions on each dimension is preferred)
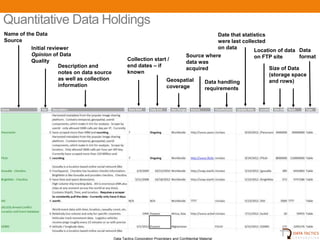
- 8. Quantitative Data Holdings Name of the Data Date that statistics Source were last collected Initial reviewer on data Location of data Data Opinion of Data Source where on FTP site format Quality Collection start / data was Description and end dates тАУ if acquired Size of Data notes on data source known (storage space as well as collection Geospatial and rows) Data handling information coverage requirements Data Tactics Corporation Proprietary and Confidential Material 10
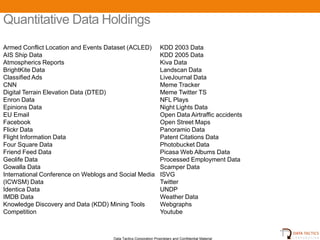
- 9. Quantitative Data Holdings Armed Conflict Location and Events Dataset (ACLED) KDD 2003 Data AIS Ship Data KDD 2005 Data Atmospherics Reports Kiva Data BrightKite Data Landscan Data Classified Ads LiveJournal Data CNN Meme Tracker Digital Terrain Elevation Data (DTED) Meme Twitter TS Enron Data NFL Plays Epinions Data Night Lights Data EU Email Open Data Airtraffic accidents Facebook Open Street Maps Flickr Data Panoramio Data Flight Information Data Patent Citations Data Four Square Data Photobucket Data Friend Feed Data Picasa Web Albums Data Geolife Data Processed Employment Data Gowalla Data Scamper Data International Conference on Weblogs and Social Media ISVG (ICWSM) Data Twitter Identica Data UNDP IMDB Data Weather Data Knowledge Discovery and Data (KDD) Mining Tools Webgraphs Competition Youtube Data Tactics Corporation Proprietary and Confidential Material
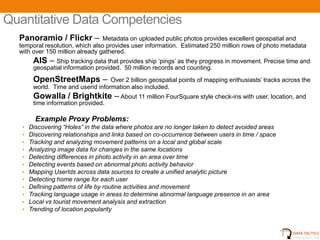
- 10. Quantitative Data Competencies Panoramio / Flickr тАУ Metadata on uploaded public photos provides excellent geospatial and temporal resolution, which also provides user information. Estimated 250 million rows of photo metadata with over 150 million already gathered. AIS тАУ Ship tracking data that provides ship тАЮpingsтАЯ as they progress in movement. Precise time and geospatial information provided. 50 million records and counting. OpenStreetMaps тАУ Over 2 billion geospatial points of mapping enthusiastsтАЯ tracks across the world. Time and userid information also included. Gowalla / Brightkite тАУ About 11 million FourSquare style check-ins with user, location, and time information provided. Example Proxy Problems: тАв Discovering тАЬHolesтАЭ in the data where photos are no longer taken to detect avoided areas тАв Discovering relationships and links based on co-occurrence between users in time / space тАв Tracking and analyzing movement patterns on a local and global scale тАв Analyzing image data for changes in the same locations тАв Detecting differences in photo activity in an area over time тАв Detecting events based on abnormal photo activity behavior тАв Mapping UserIds across data sources to create a unified analytic picture тАв Detecting home range for each user тАв Defining patterns of life by routine activities and movement тАв Tracking language usage in areas to determine abnormal language presence in an area тАв Local vs tourist movement analysis and extraction тАв Trending of location popularity UNCLASSIFIED 12
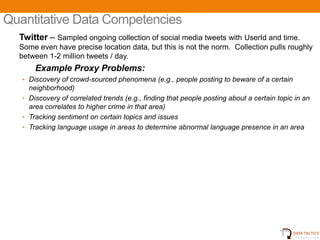
- 11. Quantitative Data Competencies Twitter тАУ Sampled ongoing collection of social media tweets with UserId and time. Some even have precise location data, but this is not the norm. Collection pulls roughly between 1-2 million tweets / day. Example Proxy Problems: тАв Discovery of crowd-sourced phenomena (e.g., people posting to beware of a certain neighborhood) тАв Discovery of correlated trends (e.g., finding that people posting about a certain topic in an area correlates to higher crime in that area) тАв Tracking sentiment on certain topics and issues тАв Tracking language usage in areas to determine abnormal language presence in an area UNCLASSIFIED 13
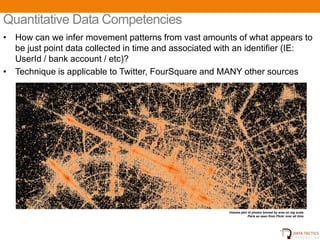
- 12. Quantitative Data Competencies тАв How can we infer movement patterns from vast amounts of what appears to be just point data collected in time and associated with an identifier (IE: UserId / bank account / etc)? тАв Technique is applicable to Twitter, FourSquare and MANY other sources Volume plot of photos binned by area on log scale Paris as seen from Flickr over all time 14
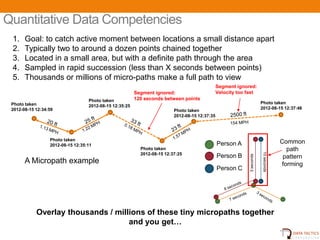
- 13. Quantitative Data Competencies 1. Goal: to catch active moment between locations a small distance apart 2. Typically two to around a dozen points chained together 3. Located in a small area, but with a definite path through the area 4. Sampled in rapid succession (less than X seconds between points) 5. Thousands or millions of micro-paths make a full path to view Segment ignored: Segment ignored: Velocity too fast Photo taken 120 seconds between points Photo taken Photo taken 2012-08-15 12:35:25 2012-08-15 12:34:59 2012-08-15 12:37:46 Photo taken 2012-08-15 12:37:35 Photo taken 2012-08-15 12:35:11 Person A Common Photo taken path 10 seconds 2012-08-15 12:37:25 Person B 3 seconds pattern A Micropath example forming Person C Overlay thousands / millions of these tiny micropaths together and you getтАж UNCLASSIFIED 15
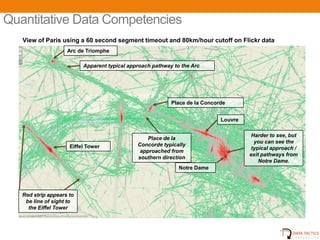
- 14. Quantitative Data Competencies View of Paris using a 60 second segment timeout and 80km/hour cutoff on Flickr data Arc de Triomphe Apparent typical approach pathway to the Arc Place de la Concorde Louvre Harder to see, but Place de la you can see the Eiffel Tower Concorde typically typical approach / approached from exit pathways from southern direction Notre Dame. Notre Dame Red strip appears to be line of sight to the Eiffel Tower UNCLASSIFIED 16
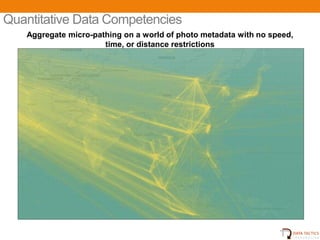
- 15. Quantitative Data Competencies Aggregate micro-pathing on a world of photo metadata with no speed, time, or distance restrictions UNCLASSIFIED 17
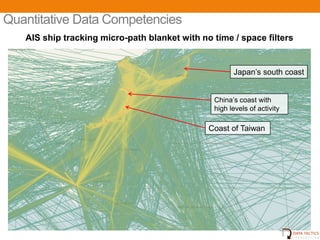
- 16. Quantitative Data Competencies AIS ship tracking micro-path blanket with no time / space filters JapanтАЯs south coast ChinaтАЯs coast with high levels of activity Coast of Taiwan UNCLASSIFIED 18
- 17. Quantitative Data Competencies Flickr Paris 2004 changes vs 2005 Hh: [HIGH, high]- an increase between Xt1 -> Xt2 relative to respective (Xt1, Xt2) reference distribution where t1, t2 belong to T. HIGH reflects a strong increase of ones own values (dxi) at location i between t1 and t2 relative to the change of neighboring values (dy). high reflects a modest increase of dy relative to values of dx. Neighbors are defined with the spatially lagged variable Wy, as the eight nearest observations. lL: low, LOW [low, LOW]- a decrease between Xt1 -> Xt2 relative to respective (Xt1, Xt2) reference distribution where t1, t2 belong to T. low reflects a modest decrease of ones own values (dxi) at location i between t1 and t2 relative to the change of neighboring values (dy). LOW reflects a strong decrease of neighboring values of dx. Neighbors are defined with the spatially lagged variable Wy, as the eight nearest observations. Flickr Paris 2011 changes vs 2010 UNCLASSIFIED 19
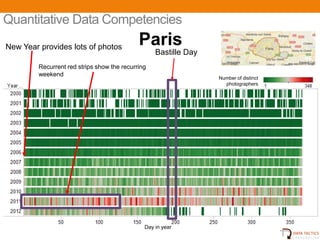
- 18. Quantitative Data Competencies New Year provides lots of photos Paris Bastille Day Recurrent red strips show the recurring weekend Number of distinct photographers Day in year UNCLASSIFIED 20
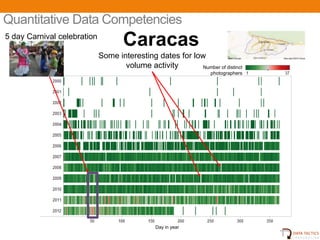
- 19. Quantitative Data Competencies 5 day Carnival celebration Caracas Some interesting dates for low volume activity Number of distinct photographers Day in year Image from www.flickr.com/photos/globovision/6911554143 UNCLASSIFIED 21
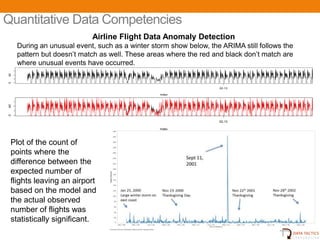
- 20. Quantitative Data Competencies Airline Flight Data Anomaly Detection During an unusual event, such as a winter storm show below, the ARIMA still follows the pattern but doesnтАЯt match as well. These areas where the red and black donтАЯt match are where unusual events have occurred. ZeroFill 40 0 02-13 Index ZeroFill 40 0 02-13 Index Plot of the count of points where the difference between the expected number of flights leaving an airport based on the model and the actual observed number of flights was statistically significant. UNCLASSIFIED 22
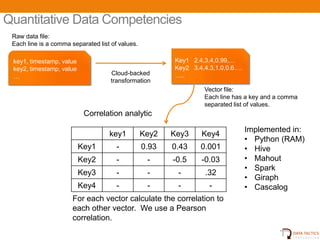
- 21. Quantitative Data Competencies Raw data file: Each line is a comma separated list of values. key1, timestamp, value Key1 2.4,3.4,0.99,тАж key2, timestamp, value Key2 3.4,4.3,1.0,0.6тАж. Cloud-backed тАж.. тАж transformation Vector file: Each line has a key and a comma separated list of values. Correlation analytic Implemented in: key1 Key2 Key3 Key4 тАв Python (RAM) Key1 - 0.93 0.43 0.001 тАв Hive Key2 - - -0.5 -0.03 тАв Mahout тАв Spark Key3 - - - .32 тАв Giraph Key4 - - - - тАв Cascalog For each vector calculate the correlation to each other vector. We use a Pearson correlation. UNCLASSIFIED 23
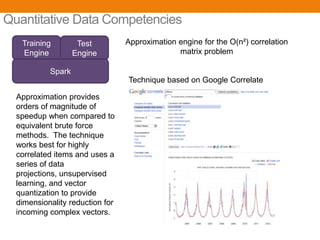
- 22. Quantitative Data Competencies Training Test Approximation engine for the O(n┬▓) correlation Engine Engine matrix problem Spark Technique based on Google Correlate Approximation provides orders of magnitude of speedup when compared to equivalent brute force methods. The technique works best for highly correlated items and uses a series of data projections, unsupervised learning, and vector quantization to provide dimensionality reduction for incoming complex vectors. UNCLASSIFIED 24
![Quantitative Data Competencies
Flickr Paris 2004 changes vs 2005
Hh: [HIGH, high]- an increase between Xt1 -> Xt2 relative to respective (Xt1, Xt2)
reference distribution where t1, t2 belong to T. HIGH reflects a strong increase
of ones own values (dxi) at location i between t1 and t2 relative to the change
of neighboring values (dy). high reflects a modest increase of dy relative to
values of dx. Neighbors are defined with the spatially lagged variable Wy, as
the eight nearest observations.
lL: low, LOW [low, LOW]- a decrease between Xt1 -> Xt2 relative to respective
(Xt1, Xt2) reference distribution where t1, t2 belong to T. low reflects a modest
decrease of ones own values (dxi) at location i between t1 and t2 relative to the
change of neighboring values (dy). LOW reflects a strong decrease of
neighboring values of dx.
Neighbors are defined with the spatially lagged variable Wy, as the eight
nearest observations.
Flickr Paris 2011 changes vs 2010
UNCLASSIFIED 19](https://image.slidesharecdn.com/capabilitiesbriefanalytics-130212123403-phpapp01/85/Capabilities-Brief-Analytics-17-320.jpg)
