High Point Police Department: Statistical Report 2013 (Focused Deterrence)
- 1. Presentation to City Council Fiscal Year Statistical Report 2012 - 2013
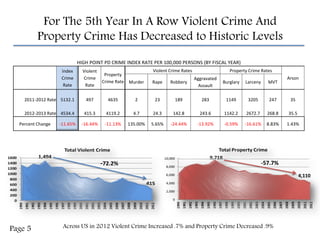
- 2. For The 5th Year In A Row Violent Crime And Property Crime Has Decreased to Historic Levels HIGH POINT PD CRIME INDEX RATE PER 100,000 PERSONS (BY FISCAL YEAR) Index Crime Rate Violent Crime Rate Property Crime Rate Murder Violent Crime Rates Property Crime Rates Rape Robbery Aggravated Assault Burglary Larceny MVT Arson 2011-2012 Rate 5132.1 497 4635 2 23 189 283 1149 3205 247 35 2012-2013 Rate 4534.4 415.3 4119.2 4.7 24.3 142.8 243.6 1142.2 2672.7 268.8 35.5 -16.44% -11.13% 135.00% 5.65% -24.44% -13.92% -0.59% -16.61% 8.83% 1.43% Percent Change -11.65% -72.2% -57.7% 4,110 Page 5 Across US in 2012 Violent Crime Increased .7% and Property Crime Decreased .9%
- 3. Breakdown of Part I Offenses Metal/Copper thefts down 24% from last fiscal year Clearance Rates for Property Crime 32.7% compared to National Average 18.6% (2011) Page 6
- 4. Calls for Service 66,445 Citizen Calls + 55,553 Officer Initiated = 121,998 Non Emergency Self- initiated Top 10 Citizen Calls for Service Pages 10-12 2,347 7. 911 Hang-up 2,187 8. Residential Alarm 2,156 9. Noise Violation 2,080 10. Traffic Related 20% 2% 2,673 6. Criminal Process Emergency 2,807 5. Non Residential Alarm Other 3,030 4. Traffic Accident –PD 911 3,290 3. Public Disturbance 45% 4,114 2. Animal Related 33% 1. Domestic Disturbance IP (2202) Other (1912) 1,635
- 5. Drug Market Initiative Areas DANIEL BROOKS EAST CENTRAL SOUTHSIDE WASHINGTON WEST END MURDER 0 1 0 0 0 RAPE 0 1 0 0 0 ROBBERY 8 5 4 7 7 AGGRAVATED ASSAULT 8 18 2 7 8 VIOLENT CRIME 16 25 6 14 15 BURGLARY 28 49 18 11 25 LARCENY 36 27 16 18 29 MOTOR VEH THEFT 4 6 2 3 13 PROPERTY CRIME 68 82 36 32 67 PART II CRIME 111 99 90 41 97 NON REPORTABLE 9 17 10 4 16 TOTAL 204 223 142 91 194 INITIATIVE YEAR CRIME 340 292 190 125 263 CHANGE SINCE INITIATIVE -40.0% -23.6% -25.3% -27.2% -26.2% Page 16
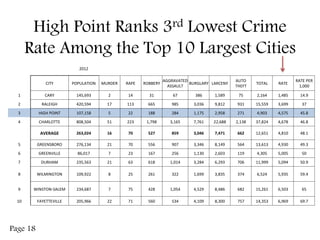
- 6. 10 Largest Cities in NC 2012 AGGRAVATED BURGLARY LARCENY ASSAULT AUTO THEFT TOTAL RATE RATE PER 1,000 22,688 2,138 37,824 4,678 46.8 3,036 9,812 931 15,559 3,699 37 907 3,346 8,149 564 13,613 4,930 49.3 428 1,054 4,529 8,486 682 15,261 6,503 65 63 618 1,014 3,284 6,293 706 11,999 5,094 50.9 22 71 560 534 4,109 8,300 757 14,353 6,969 69.7 145,693 2 14 31 67 386 1,589 75 2,164 1,485 14.9 WILMINGTON 109,922 8 25 261 322 1,699 3,835 374 6,524 5,935 59.4 9 HIGH POINT 107,158 5 22 188 284 1,175 2,958 271 4,903 4,575 45.8 10 GREENVILLE 86,017 7 23 167 256 1,130 2,603 119 4,305 5,005 50 AVERAGE 263,024 16 70 527 859 3,046 7,471 662 12,651 4,810 48.1 CITY POPULATION MURDER RAPE ROBBERY 1 CHARLOTTE 808,504 51 223 1,798 3,165 7,761 2 RALEIGH 420,594 17 113 665 985 3 GREENSBORO 276,134 21 70 556 4 WINSTON-SALEM 234,687 7 75 5 DURHAM 235,563 21 6 FAYETTEVILLE 205,966 7 CARY 8
- 7. High Point Ranks 3rd Lowest Crime Rate Among the Top 10 Largest Cities 2012 AGGRAVATED BURGLARY LARCENY ASSAULT AUTO THEFT TOTAL RATE RATE PER 1,000 1,589 75 2,164 1,485 14.9 3,036 9,812 931 15,559 3,699 37 284 1,175 2,958 271 4,903 4,575 45.8 1,798 3,165 7,761 22,688 2,138 37,824 4,678 46.8 70 527 859 3,046 7,471 662 12,651 4,810 48.1 21 70 556 907 3,346 8,149 564 13,613 4,930 49.3 86,017 7 23 167 256 1,130 2,603 119 4,305 5,005 50 DURHAM 235,563 21 63 618 1,014 3,284 6,293 706 11,999 5,094 50.9 8 WILMINGTON 109,922 8 25 261 322 1,699 3,835 374 6,524 5,935 59.4 9 WINSTON-SALEM 234,687 7 75 428 1,054 4,529 8,486 682 15,261 6,503 65 10 FAYETTEVILLE 205,966 22 71 560 534 4,109 8,300 757 14,353 6,969 69.7 CITY POPULATION MURDER RAPE ROBBERY 1 CARY 145,693 2 14 31 67 386 2 RALEIGH 420,594 17 113 665 985 3 HIGH POINT 107,158 5 22 188 4 CHARLOTTE 808,504 51 223 AVERAGE 263,024 16 5 GREENSBORO 276,134 6 GREENVILLE 7 Page 18
- 8. Offender Focused Domestic Violence Initiative Fully Implemented April 1, 2012 DV Related Homicides Drop 2004 – 2008 = 17 to 2009 -2013 = 1 DV Offenders Can Be Deterred Notified / #Reoffended B List (most serious) 46 / 4 C List (1st time charged) 712 / 52 D List (1st call) 182 / 14 Low Recidivism Rate for Notified Offenders Total Notified = 940 Reoffended = 70 Recidivism rate = 7.4% Domestic Calls Decrease from 4,901 to 4,114 75 fewer arrests Apr –Sept 2012 compared to 2013
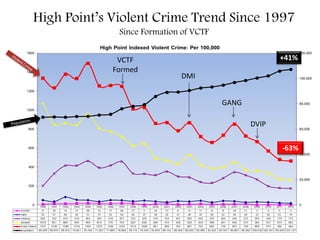
- 9. High Point’s Violent Crime Trend Since 1997 Since Formation of VCTF VCTF Formed +41% DMI GANG DVIP -63%
- 10. Questions? Presentation to City Council November 7, 2013


