11b Hazard Mapping.ppt
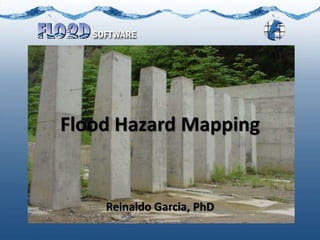
- 1. Flood Hazard Mapping Reinaldo Garcia, PhD
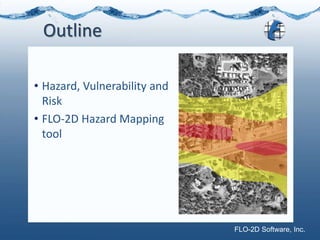
- 2. FLO-2D Software, Inc. Outline ? Hazard, Vulnerability and Risk ? FLO-2D Hazard Mapping tool
- 3. FLO-2D Software, Inc. Hazard ≠ Risk Hazard ?Related to an event that poses a danger Vulnerability ?Susceptibility to specific hazard Risk ?Probability of suffering harm or loss
- 4. FLO-2D Software, Inc. Hazard ≠ Risk Risk = Hazard ∩ Vulnerability For specific hazard!!!
- 6. FLO-2D Software, Inc. Hazard Zones for Flooding ?Hazard Intensity ?USA: f(h) ?Austria: f(h, v2/2g) ?Switzerland: f(h, v × h) ?Flood hazard depends on Depth Velocity Frequency of the hazardous event
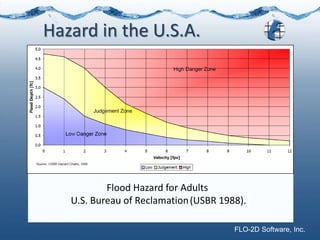
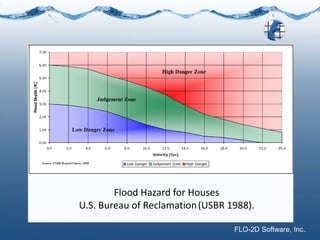
- 7. FLO-2D Software, Inc. Hazard in the U.S.A. ? The U.S. Bureau of Reclamation (1988) also identifies hazard as a combination of depth and velocity and differentiates these for adults, cars, and houses as shown in the following figures. USBR. 1988. Downstream Hazard Classification Guidelines. ACER Technical Memorandum No. 11.
- 8. FLO-2D Software, Inc. Hazard in the U.S.A. Flood Hazard for Adults U.S. Bureau of Reclamation(USBR 1988).
- 9. FLO-2D Software, Inc. Flood Hazard for Houses U.S. Bureau of Reclamation(USBR 1988).
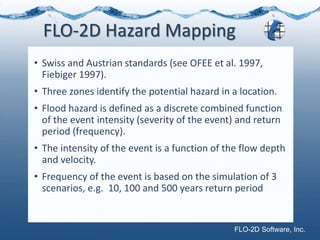
- 10. FLO-2D Software, Inc. ? Swiss and Austrian standards (see OFEE et al. 1997, Fiebiger 1997). ? Three zones identify the potential hazard in a location. ? Flood hazard is defined as a discrete combined function of the event intensity (severity of the event) and return period (frequency). ? The intensity of the event is a function of the flow depth and velocity. ? Frequency of the event is based on the simulation of 3 scenarios, e.g. 10, 100 and 500 years return period FLO-2D Hazard Mapping
- 11. FLO-2D Software, Inc. Spreadsheet H 2 3 3 3 3 3 3 3 3 3 3 3 3 3 3 3 3 3 3 3 3 3 3 3 3 3 3 3 3 3 3 3 3 3 3 3 3 3 3 3 3 3 3 3 1.9 3 3 3 3 3 3 3 3 3 3 3 3 3 3 3 3 3 3 3 3 3 3 3 3 3 3 3 3 3 3 3 3 3 3 3 3 3 3 3 3 3 3 3 1.8 3 3 3 3 3 3 3 3 3 3 3 3 3 3 3 3 3 3 3 3 3 3 3 3 3 3 3 3 3 3 3 3 3 3 3 3 3 3 3 3 3 3 3 1.7 3 3 3 3 3 3 3 3 3 3 3 3 3 3 3 3 3 3 3 3 3 3 3 3 3 3 3 3 3 3 3 3 3 3 3 3 3 3 3 3 3 3 3 1.6 3 3 3 3 3 3 3 3 3 3 3 3 3 3 3 3 3 3 3 3 3 3 3 3 3 3 3 3 3 3 3 3 3 3 3 3 3 3 3 3 3 3 3 1.5 3 3 3 3 3 3 3 3 3 3 3 3 3 3 3 3 3 3 3 3 3 3 3 3 3 3 3 3 3 3 3 3 3 3 3 3 3 3 3 3 3 3 3 1.4 3 3 3 3 3 3 3 3 3 3 3 3 3 3 3 3 3 3 3 3 3 3 3 3 3 3 3 3 3 3 3 3 3 3 3 3 3 3 3 3 3 3 3 1.3 3 3 3 3 3 3 3 3 3 3 3 3 3 3 3 3 3 3 3 3 3 3 3 3 3 3 3 3 3 3 3 3 3 3 3 3 3 3 3 3 3 3 3 1.2 3 3 3 3 3 3 3 3 3 3 3 3 3 3 3 3 3 3 3 3 3 3 3 3 3 3 3 3 3 3 3 3 3 3 3 3 3 3 3 3 3 3 3 1.1 3 3 3 3 3 3 3 3 3 3 3 3 3 3 3 3 3 3 3 3 3 3 3 3 3 3 3 3 3 3 3 3 3 3 3 3 3 3 3 3 3 3 3 1 1 1 2 2 2 2 2 2 2 2 2 2 2 2 2 2 2 2 2 2 3 3 3 3 3 3 3 3 3 3 3 3 3 3 3 3 3 3 3 3 3 3 3 0.9 1 1 2 2 2 2 2 2 2 2 2 2 2 2 2 2 2 2 2 2 2 2 3 3 3 3 3 3 3 3 3 3 3 3 3 3 3 3 3 3 3 3 3 0.8 1 1 2 2 2 2 2 2 2 2 2 2 2 2 2 2 2 2 2 2 2 2 2 2 2 3 3 3 3 3 3 3 3 3 3 3 3 3 3 3 3 3 3 0.7 1 1 2 2 2 2 2 2 2 2 2 2 2 2 2 2 2 2 2 2 2 2 2 2 2 2 2 2 3 3 3 3 3 3 3 3 3 3 3 3 3 3 3 0.6 1 1 1 2 2 2 2 2 2 2 2 2 2 2 2 2 2 2 2 2 2 2 2 2 2 2 2 2 2 2 2 2 2 3 3 3 3 3 3 3 3 3 3 0.5 1 1 1 1 2 2 2 2 2 2 2 2 2 2 2 2 2 2 2 2 2 2 2 2 2 2 2 2 2 2 2 2 2 2 2 2 2 2 2 2 3 3 3 0.4 1 1 1 1 1 2 2 2 2 2 2 2 2 2 2 2 2 2 2 2 2 2 2 2 2 2 2 2 2 2 2 2 2 2 2 2 2 2 2 2 2 2 2 0.3 1 1 1 1 1 1 2 2 2 2 2 2 2 2 2 2 2 2 2 2 2 2 2 2 2 2 2 2 2 2 2 2 2 2 2 2 2 2 2 2 2 2 2 0.2 1 1 1 1 1 1 1 1 1 1 2 2 2 2 2 2 2 2 2 2 2 2 2 2 2 2 2 2 2 2 2 2 2 2 2 2 2 2 2 2 2 2 2 0.1 1 1 1 1 1 1 1 1 1 1 1 1 1 1 1 1 1 1 1 1 2 2 2 2 2 2 2 2 2 2 2 2 2 2 2 2 2 2 2 2 2 2 2 0 0 0 0 0 0 0 0 0 0 0 0 0 0 0 0 0 0 0 0 0 0 0 0 0 0 0 0 0 0 0 0 0 0 0 0 0 0 0 0 0 0 0 0 VxH 0.05 0.1 0.15 0.2 0.25 0.3 0.35 0.4 0.45 0.5 0.55 0.6 0.65 0.7 0.75 0.8 0.85 0.9 0.95 1 1.05 1.1 1.15 1.2 1.25 1.3 1.35 1.4 1.45 1.5 1.55 1.6 1.65 1.7 1.75 1.8 1.85 1.9 1.95 2 2.05 2.1 2.15
- 13. FLO-2D Software, Inc. Hazard Levels
- 14. FLO-2D Software, Inc. Hazard map legend Hazard level Map color Legend High Red People are in danger both inside and outside of structures. Buildings are in danger of being destroyed. Medium Orange People are in danger outside or structures. Buildings may suffer damage or possible destruction depending on construction materials. Low Yellow Danger to people is low. Buildings may suffer limited damage, but flooding or sedimentation may affect structures.
- 15. FLO-2D Software, Inc. Hazard mapping workflow ? Apply hydrological model: Inflow hydrographs ? Apply FLO-2D model to obtain maximum velocities and maximum depth maps for mud floods of three return periods (10, 100 and 500 years or other) ? Determine intensity maps for these three events based on the established criteria ? Determine hazard levels from intensity maps and event return period
- 16. FLO-2D Software, Inc. Case study ? Debris Flow and Flooding. ? Northern Venezuela. ? December 1999. ? 20 alluvial fans affected. ? ~15.000 people died/disappeared . ? US $5+ billion in losses.
- 19. FLO-2D Software, Inc. Macuto River in the alluvial fan, Sept. 2001.
- 33. FLO-2D Software, Inc. Rainfall data ? 911 mm /35.9 in from 14th to 16th ? 1207 mm/47.5 in December 1999 ? 250 year event ?Annual average 523 mm /20.6 in ?Annual maximum 961 mm/37.8 in
- 34. FLO-2D Software, Inc. RESULTS FOR 10 YEAR EVENT
- 35. FLO-2D Software, Inc. RESULTS FOR 100 YEAR EVENT
- 36. FLO-2D Software, Inc. RESULTS FOR 500 YEAR EVENT

