
Pbd Benchmarking
- 1. Benchmarking For Your Success
- 2. What Is Project Benchmarking And Why Should A Project Manger Care? Benchmarking is a euphemism for legally ripping off someone else’s ideas….. ( www.leadingexcellence.com )
- 3. Benchmarking Defined Benchmarking is the systematic process of measuring one’s performance against recognized leaders for the purpose of determining best practices that lead to superior performance when adapted and utilized.
- 4. Project Benchmarking Compare to Best in Class Identifies organizations with best project practices and results and assists in adapting their practices for innovation in one’s own organization or one’s own projects. Think Outside the Box Enables Project and Program Managers to learn what is possible outside their current belief system. Improve Projects and Overall System When carried out correctly, benchmarking can help individual project managers and project organizations achieve a breakthrough in their performance.
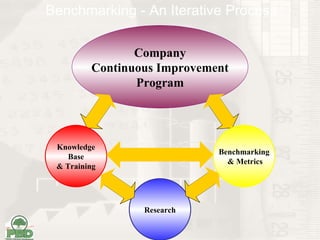
- 5. Company Continuous Improvement Program Benchmarking - An Iterative Process Research Knowledge Base & Training Benchmarking & Metrics
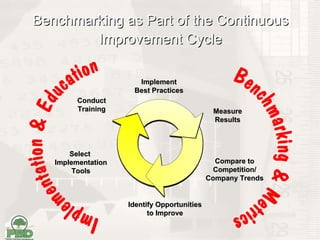
- 6. Benchmarking as Part of the Continuous Improvement Cycle Implement Best Practices Measure Results Identify Opportunities to Improve Select Implementation Tools Conduct Training Compare to Competition/ Company Trends
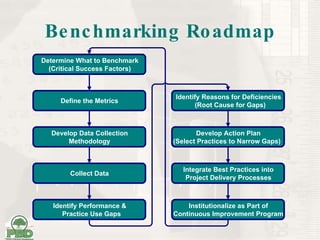
- 7. Benchmarking Roadmap Determine What to Benchmark (Critical Success Factors) Define the Metrics Develop Data Collection Methodology Collect Data Identify Performance & Practice Use Gaps Identify Reasons for Deficiencies (Root Cause for Gaps) Develop Action Plan (Select Practices to Narrow Gaps) Integrate Best Practices into Project Delivery Processes Institutionalize as Part of Continuous Improvement Program
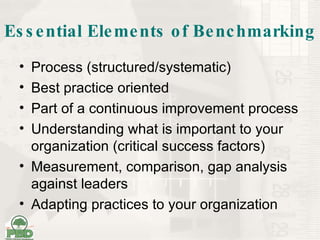
- 8. Essential Elements of Benchmarking Process (structured/systematic) Best practice oriented Part of a continuous improvement process Understanding what is important to your organization (critical success factors) Measurement, comparison, gap analysis against leaders Adapting practices to your organization
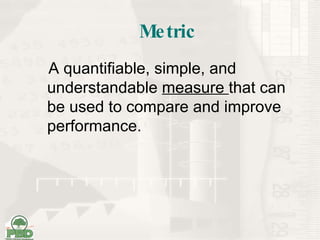
- 9. Metric A quantifiable, simple, and understandable measure that can be used to compare and improve performance.
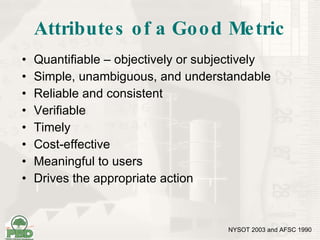
- 10. Attributes of a Good Metric Quantifiable – objectively or subjectively Simple, unambiguous, and understandable Reliable and consistent Verifiable Timely Cost-effective Meaningful to users Drives the appropriate action NYSOT 2003 and AFSC 1990
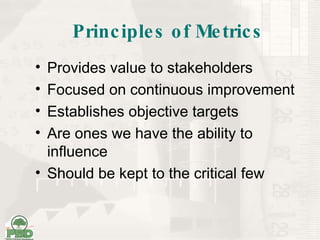
- 11. Principles of Metrics Provides value to stakeholders Focused on continuous improvement Establishes objective targets Are ones we have the ability to influence Should be kept to the critical few
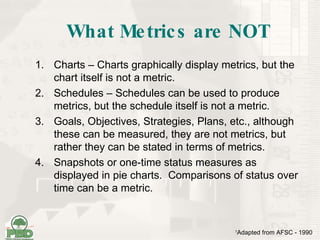
- 12. What Metrics are NOT Charts – Charts graphically display metrics, but the chart itself is not a metric. Schedules – Schedules can be used to produce metrics, but the schedule itself is not a metric. Goals, Objectives, Strategies, Plans, etc., although these can be measured, they are not metrics, but rather they can be stated in terms of metrics. Snapshots or one-time status measures as displayed in pie charts. Comparisons of status over time can be a metric. 1 Adapted from AFSC - 1990
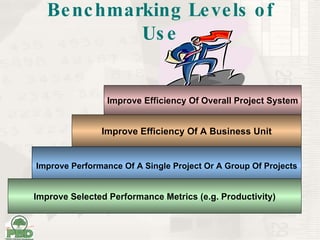
- 13. Improve Efficiency Of A Business Unit Improve Performance Of A Single Project Or A Group Of Projects Improve Efficiency Of Overall Project System Improve Selected Performance Metrics (e.g. Productivity) Benchmarking Levels of Use
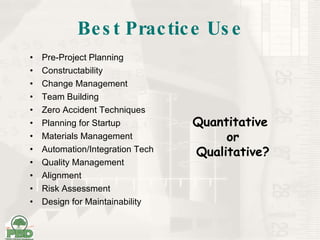
- 16. Best Practice Use Pre-Project Planning Constructability Change Management Team Building Zero Accident Techniques Planning for Startup Materials Management Automation/Integration Tech Quality Management Alignment Risk Assessment Design for Maintainability Quantitative or Qualitative?
- 18. Summary Best Practices can improve performance. Benchmarking helps you to: quantify performance and practice use. establish improvement goals. achieve “best in class performance.”
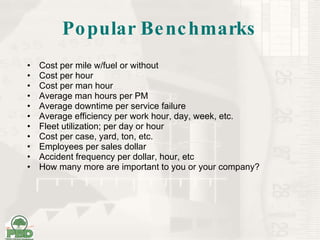
- 19. Popular Benchmarks Cost per mile w/fuel or without Cost per hour Cost per man hour Average man hours per PM Average downtime per service failure Average efficiency per work hour, day, week, etc. Fleet utilization; per day or hour Cost per case, yard, ton, etc. Employees per sales dollar Accident frequency per dollar, hour, etc How many more are important to you or your company?
- 20. Questions? What gets measured - gets improved