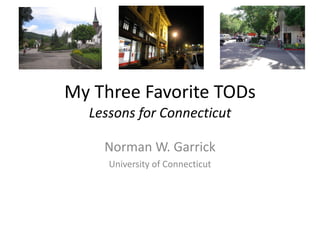
My Three Favorite Transit Oriented Developments
- 1. My Three Favorite TODs Lessons for Connecticut Norman W. Garrick University of Connecticut
- 2. TODs in Connecticut Past and Present In 1950 Almost 70 % of Connecticut lived in the green areas By 2000 Only 50 % of Connecticut lived in these same areas In other words, in 1950 most of ConnecticutŌĆÖs population lived in what we now call TOD The bad news: these areas are mostly no longer TODs The good news: they can again become TODs
- 4. Vehicle Miles Traveled Ref for Vehicle Data ---- http://www1.eere.energy.gov/vehiclesandfuels/facts/2007_fcvt_fotw474.html Ref for VMT ---- http://www.fhwa.dot.gov/policyinformation/statistics/2007/vmt421.cfm 1908 The Model T 1930s The Depression 1940-45 World War II 1956 Highway Bill 1973 First Oil Crisis 1979 Second Oil Crisis 2004 - ??? 1949 Housing Act
- 5. Vehicle Miles Traveled Ref for Vehicle Data ---- http://www1.eere.energy.gov/vehiclesandfuels/facts/2007_fcvt_fotw474.html Ref for VMT ---- http://www.fhwa.dot.gov/policyinformation/statistics/2007/vmt421.cfm
- 6. Driving to Exhaustion 1946 The average American drove 6 miles every day 2004 The average American drove 30 miles per day
- 7. Cities will be part of the country; I shall live 30 miles from my office in one direction, under a pine tree; my secretary will live 30 miles away from it too, in the other direction, under another pine tree. We shall both have our own car. We shall use up tires, wear out road surfaces and gears, consume oil and gasoline. All of which will necessitate a great deal of work ŌĆ” enough for all. - Le Corbusier, 1935
- 8. ╠²
- 9. ╠²
- 10. ╠²
- 11. ╠²
- 12. ╠²
- 13. ╠²
- 14. Norman W. Garrick Kingston, Jamaica
- 15. Storrs, CT
- 17. ╠²
- 18. Atlanta, GA
- 19. Hartford 1930s
- 20. Hartford 1960s
- 21. ╠²
- 22. ╠²
- 23. Era of Transportation Choices? The Automobile Era
- 24. TALK about making an entrance. Intent on arriving at a recent gala in style, Topaz Page-Green swooshed onto the scene on her trusty vintage roadster. She wore, of all things, a scarlet dress with a slinky 1920s feel. ŌĆ£It was to the ankles,ŌĆØ she recalled. ŌĆ£I had to hoist it up.ŌĆØ Fashion & Style By RUTH LA FERLA Published: September 29, 2010
- 26. ╠²
- 27. Zurich Airport Zurich Urdorf
- 28. ╠²
- 29. ╠²
- 30. ╠²
- 31. ╠²
- 32. ╠²
- 33. Dupont Circle, Washington, DC
- 34. ╠²
- 35. ╠²
- 38. ╠²
- 39. ╠²
- 40. ╠²
- 41. ╠²
- 42. What Do These Places Have in Common? Population in Transit Area (500 acres surrounding station) Urdorf 7,000 Dupont Circle 18,000 Davis 3,000 Density Varies Widely Davis has about the same density as Milford Dupont Circle has twice the residential density of Stamford
- 43. What Do These Places Have in Common? Mixed Residential and Job Center (500 acres surrounding station) Urdorf 7,000 residents 100s of Jobs Dupont Circle 18,000 residents 83,000 Jobs Davis 3,000 3,600 Jobs Davis has about 50% more jobs than Milford Dupont Circle has 5 times more jobs than Stamford, 11 times more than Bridgeport
- 44. What Do These Places Have in Common? Transportation Options (500 acres surrounding station) Urdorf 28 % Public Transportation 22 % Walk and Bike 45 % Car Dupont Circle 31 % Public Transportation 40 % Walk and Bike 23 % Car Davis 4 % Public Transportation 40 % Walk and Bike 51 % Car
- 45. The Three TODs Provide the Option of Living Without a Car
- 46. The Three TODs Are Built At Human Scale
- 47. Living Without a Car in Connecticut Is It Possible? New Haven 0.24 cars/person Stamford 0.25 cars/person South Norwalk 0.41 cars/person Bridgeport 0.59 cars/person Greenwich 0.62 cars/person
- 48. TODs in Connecticut How are They Doing? Dupont Circle 31 % Public Transportation 40 % Walk and Bike 23 % Car 18,000 83,000 New Haven 18% Public Transit 23% Walk and Biking 57% Car 4,900 Residents 19,000 Jobs Stamford 17% Public Transit 13% Walk and Biking 68% Car 9,000 Residents 15,000 Jobs
- 49. Zoning Reform
- 50. Parking Reform
- 52. High Speed Rail Good for Connecticut?
- 53. ╠²
- 54. ╠²


