Classification Model - Decision Tree
ŌĆóDownload as PPTX, PDFŌĆó
1 likeŌĆó540 views

This document presents a classification model to predict whether a house is made of brick or not based on various variables like price, square footage, number of bedrooms, etc. It describes collecting data on 128 house sales and using variables like price, square footage, bedrooms in a decision tree model built with Rattle. The model achieved a classification accuracy of 80.8% based on a confusion matrix and ROC curve evaluation. In conclusion, it finds that brick houses are generally more expensive than wooden houses due to differences in construction materials, flexibility, and suitability for different climates.


![INDUCTION OF DECISION TREE
Gini Index Calculation[1-SUM(P^2)]
ROOT Node
Internal price node
Internal neighbourhood
node
Internal SQ FT NODE
0.4278
0.3078
0.3648
0.4422
0.12Diff b/w Root and Internal price node
Diff b/w Root and Internal
0.063neighbourhood Node
Information Gain Calculation[-SUM(PLOG 2 (P)]
GAIN
ROOT Node
0.893173458
0.1917019
Internal price node
0.70147146
98Diff b/w ROOT and Internal price node
Internal neighbourhood
0.0981331Diff b/w Root and Internal
node
0.795040279
79neighbourhood Node
ACTUAL
NO
YES
TOTAL
ACCURACY(TP+TN/P+N)
ERROR
RATE(FP+FN/P+N)
CONFUSION MATRIX
PREDICTED
NO
(TN)14
(FN)3
YES
(FP)2
(TP)7
17
0.807692308
0.192307692
TOTAL
16
10
9
26](https://image.slidesharecdn.com/classificationmodeldecisiontree-140210011210-phpapp01/85/Classification-Model-Decision-Tree-10-320.jpg)
Classification Model - Decision Tree
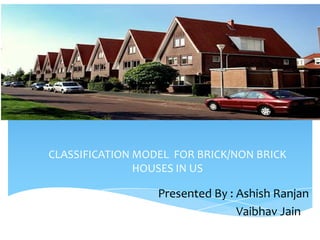
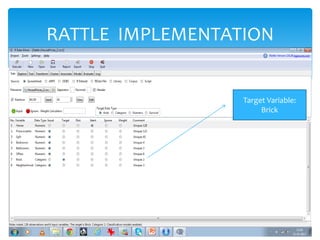
- 1. CLASSIFICATION MODEL FOR BRICK/NON BRICK HOUSES IN US Presented By : Ashish Ranjan Vaibhav Jain
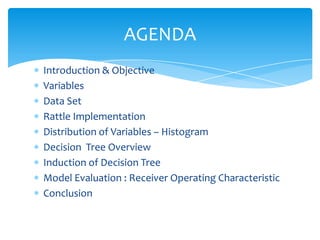
- 2. AGENDA Introduction & Objective Variables Data Set Rattle Implementation Distribution of Variables ŌĆō Histogram Decision Tree Overview Induction of Decision Tree Model Evaluation : Receiver Operating Characteristic Conclusion
- 3. CASE STUDY ŌĆō INTRODUCTION & OBJECTIVE Mr. Peter in US, after completing his MBA from University of California started working with a realtor Mannubhai Patel, who has hired him as a business analyst. Mannubhai has told him that they are in the competitive New York retail market and therefore he needs all the help from him to get ahead. Peter brainstormed a bit and skills to make his Boss understand the classification of Brick and Non Brick Houses relation with Price in US Real Estate Sector. He has collected some data to analyze. Source of Data ŌĆō www.analyticstraining.in
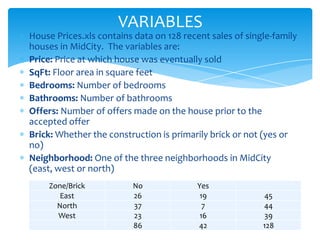
- 4. VARIABLES House Prices.xls contains data on 128 recent sales of single-family houses in MidCity. The variables are: Price: Price at which house was eventually sold SqFt: Floor area in square feet Bedrooms: Number of bedrooms Bathrooms: Number of bathrooms Offers: Number of offers made on the house prior to the accepted offer Brick: Whether the construction is primarily brick or not (yes or no) Neighborhood: One of the three neighborhoods in MidCity (east, west or north) Zone/Brick East North West No 26 37 23 86 Yes 19 7 16 42 45 44 39 128
- 5. DATA SET
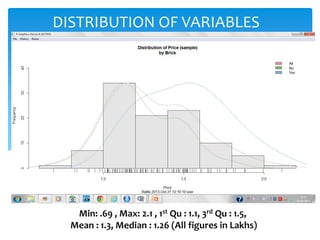
- 7. DISTRIBUTION OF VARIABLES Min: .69 , Max: 2.1 , 1st Qu : 1.1, 3rd Qu : 1.5, Mean : 1.3, Median : 1.26 (All figures in Lakhs)
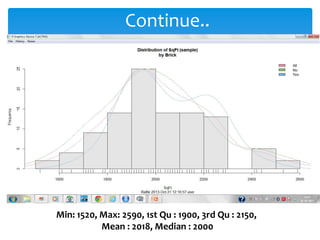
- 8. Continue.. Min: 1520, Max: 2590, 1st Qu : 1900, 3rd Qu : 2150, Mean : 2018, Median : 2000
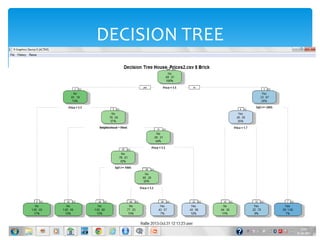
- 10. INDUCTION OF DECISION TREE Gini Index Calculation[1-SUM(P^2)] ROOT Node Internal price node Internal neighbourhood node Internal SQ FT NODE 0.4278 0.3078 0.3648 0.4422 0.12Diff b/w Root and Internal price node Diff b/w Root and Internal 0.063neighbourhood Node Information Gain Calculation[-SUM(PLOG 2 (P)] GAIN ROOT Node 0.893173458 0.1917019 Internal price node 0.70147146 98Diff b/w ROOT and Internal price node Internal neighbourhood 0.0981331Diff b/w Root and Internal node 0.795040279 79neighbourhood Node ACTUAL NO YES TOTAL ACCURACY(TP+TN/P+N) ERROR RATE(FP+FN/P+N) CONFUSION MATRIX PREDICTED NO (TN)14 (FN)3 YES (FP)2 (TP)7 17 0.807692308 0.192307692 TOTAL 16 10 9 26
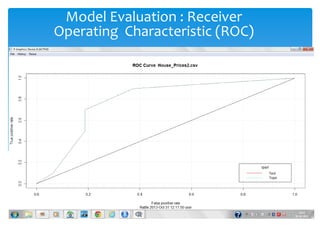
- 11. Model Evaluation : Receiver Operating Characteristic (ROC)
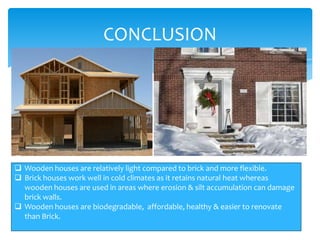
- 12. CONCLUSION ’ü▒ Brick houses are more costlier than wooden houses. ’ü▒ Wooden houses are relatively light compared to brick and more flexible. ’ü▒ Brick houses work well in cold climates as it retains natural heat whereas wooden houses are used in areas where erosion & silt accumulation can damage brick walls. ’ü▒ Wooden houses are biodegradable, affordable, healthy & easier to renovate than Brick.