ݺߣ

ݺߣShare a Scribd company logo
? MR RIVA KAMAJAYA?
The material produced in this document is intended for informational purposes only and should not be construed as an offer or solicitation for the purchase or sale of any financial instrument. The information provided herein reflects current market practices and is not intended to constitute
legal, tax, or accounting advice. The information and data contained herein has been obtained from internal data processing, fund administrators as well as other outside sources and, although it is believed to be accurate, no guarantee of completeness or accuracy is being made.
Bloomberg LP shall not be liable for any losses or damage that anyone may suffer as a result of relying on this information. The information may be changed by Bloomberg LP at any time.
Bloomberg@ Date Printed: ? 06/24/2015? ?-? Page 1 of 2
EQS
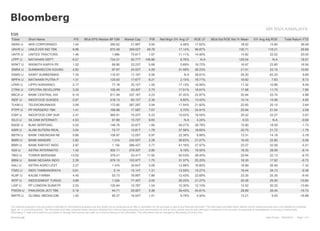
Ticker Short Name P/S?? BEst EPS Median BF12M?? Market Cap?? P/B?? Net Mrgn 3Yr Avg LF?? ROE LF?? BEst Est ROE Nxt Yr Mean?? 5Yr Avg Adj ROE?? Total Return YTD
AKRA IJ AKR CORPORINDO 1.04?? 290.62?? 21.96T?? 3.94?? 4.08%?? 17.62%?? 18.02?? 15.85?? 36.09
UNVR IJ UNILEVER IND TBK 8.96?? 872.48?? 309.02T?? 49.78?? 17.14%?? 99.87%?? 130.71?? 116.21?? 26.69
UNTR IJ UNITED TRACTORS 1.46?? 1.68k?? 75.81T?? 1.97?? 11.11%?? 14.90%?? 14.82?? 22.02?? 20.05
LPPF IJ MATAHARI DEPT 6.27?? 724.31?? 50.77T?? 146.86?? 8.76%?? N.A?? 129.54?? N.A?? 18.07
WSKT IJ WASKITA KARYA PE 1.52?? 69.80?? 23.23T?? 5.68?? 0.69%?? 19.72%?? 16.67?? 23.80?? 16.56
SMRA IJ SUMMARECON AGUNG 4.62?? 97.67?? 24.02T?? 4.29?? 31.08%?? 26.23%?? 21.51?? 22.15?? 10.83
SSMS IJ SAWIT SUMBERMAS 7.35?? 110.97?? 17.19T?? 5.56?? N.A?? 28.81%?? 26.30?? 83.33?? 9.68
MPPA IJ MATAHARI PUTRA P 1.31?? 120.93?? 17.67T?? 6.21?? 2.15%?? 18.71%?? 19.82?? 7.63?? 8.73
LPKR IJ LIPPO KARAWACI 2.17?? 77.18?? 25.15T?? 1.50?? 17.13%?? 16.95%?? 11.32?? 10.89?? 8.49
CTRA IJ CIPUTRA DEVELOPM 3.20?? 100.49?? 20.40T?? 2.75?? 17.01%?? 18.61%?? 17.68?? 11.70?? 7.60
BBCA IJ BANK CENTRAL ASI 6.19?? 811.49?? 337.16T?? 4.23?? 37.45%?? 22.87%?? 20.94?? 25.74?? 4.88
INDF IJ INDOFOOD SUKSES 0.97?? 516.13?? 60.15T?? 2.30?? 6.60%?? 13.42%?? 15.14?? 15.06?? 4.65
TLKM IJ TELEKOMUNIKASI 3.06?? 172.60?? 287.28T?? 3.94?? 17.04%?? 21.82%?? 22.65?? 25.15?? 2.64
PTPP IJ PP PERSERO TBK 1.41?? 169.96?? 17.58T?? 7.07?? 3.70%?? 24.91%?? 25.94?? 21.54?? 2.09
ICBP IJ INDOFOOD CBP SUK 2.47?? 565.91?? 75.22T?? 5.23?? 10.02%?? 19.55%?? 20.42?? 22.27?? 0.07
SILO IJ SILOAM INTERNATI 4.53?? 97.66?? 15.72T?? 9.65?? N.A?? 4.24%?? 6.53?? N.A?? -0.69
BSDE IJ BUMI SERPONG 5.55?? 148.76?? 33.87T?? 1.95?? 49.27%?? 28.78%?? 15.90?? 18.59?? -1.73
ASRI IJ ALAM SUTERA REAL 3.04?? 75.77?? 10.81T?? 1.78?? 37.56%?? 18.65%?? 20.75?? 21.72?? -1.79
BBTN IJ BANK TABUNGAN NE 0.86?? 158.97?? 12.05T?? 0.97?? 22.38%?? 9.88%?? 13.31?? 14.18?? -3.78
BMRI IJ BANK MANDIRI 2.82?? 1.01k?? 234.50T?? 2.28?? 36.83%?? 21.07%?? 19.45?? 22.80?? -5.08
BBRI IJ BANK RAKYAT INDO 2.97?? 1.15k?? 266.43T?? 2.77?? 41.16%?? 27.97%?? 23.27?? 32.09?? -5.21
ASII IJ ASTRA INTERNATIO 1.42?? 500.11?? 276.30T?? 2.80?? 9.19%?? 19.50%?? 18.35?? 28.09?? -6.14
TBIG IJ TOWER BERSAMA 13.02?? 379.41?? 43.41T?? 11.92?? 50.53%?? 28.40%?? 25.94?? 22.13?? -6.70
BBNI IJ BANK NEGARA INDO 2.28?? 679.15?? 103.97T?? 1.75?? 31.37%?? 20.20%?? 18.30?? 17.92?? -6.73
AALI IJ ASTRA AGRO LEST 2.27?? 1.47k?? 34.64T?? 3.09?? 12.99%?? 16.85%?? 18.89?? 26.46?? -7.42
ITMG IJ INDO TAMBANGRAYA 0.61?? 0.14?? 15.14T?? 1.31?? 12.59%?? 15.27%?? 16.44?? 34.13?? -9.39
KLBF IJ KALBE FARMA 4.45?? 53.73?? 76.88T?? 7.86?? 12.43%?? 22.69%?? 23.35?? 25.35?? -9.45
INTP IJ INDOCEMENT TUNGG 3.89?? 1.52k?? 77.40T?? 3.00?? 26.25%?? 21.27%?? 20.26?? 25.00?? -10.84
LSIP IJ PP LONDON SUMATR 2.55?? 125.64?? 10.78T?? 1.54?? 15.30%?? 12.10%?? 12.52?? 20.33?? -13.84
PWON IJ PAKUWON JATI TBK 5.19?? 44.71?? 20.90T?? 3.36?? 39.43%?? 45.61%?? 28.89?? 29.45?? -15.73
BMTR IJ GLOBAL MEDIACOM 1.50?? 95.27?? 16.54T?? 1.41?? 9.79%?? 4.50%?? 12.21?? 9.00?? -16.66
? MR RIVA KAMAJAYA?
The material produced in this document is intended for informational purposes only and should not be construed as an offer or solicitation for the purchase or sale of any financial instrument. The information provided herein reflects current market practices and is not intended to constitute
legal, tax, or accounting advice. The information and data contained herein has been obtained from internal data processing, fund administrators as well as other outside sources and, although it is believed to be accurate, no guarantee of completeness or accuracy is being made.
Bloomberg LP shall not be liable for any losses or damage that anyone may suffer as a result of relying on this information. The information may be changed by Bloomberg LP at any time.
Bloomberg@ Date Printed: ? 06/24/2015? ?-? Page 2 of 2
EQS
Ticker Short Name P/S?? BEst EPS Median BF12M?? Market Cap?? P/B?? Net Mrgn 3Yr Avg LF?? ROE LF?? BEst Est ROE Nxt Yr Mean?? 5Yr Avg Adj ROE?? Total Return YTD
SCMA IJ SURYA CITRA MEDI 10.31?? 123.69?? 40.94T?? 11.07?? 36.33%?? 42.77%?? 43.58?? 50.47?? -18.06
JSMR IJ JASA MARGA 4.29?? 262.90?? 38.42T?? 4.18?? 16.09%?? 14.70%?? 16.88?? 15.65?? -19.04
EXCL IJ XL AXIATA TBK PT 1.41?? 85.73?? 32.88T?? 2.51?? -0.22%?? -14.61%?? 6.57?? 14.28?? -20.86
MNCN IJ MEDIA NUSANTARA 4.09?? 152.87?? 27.48T?? 2.96?? 25.27%?? 19.55%?? 21.56?? 21.17?? -21.97
SMGR IJ SEMEN INDONESIA 2.69?? 988.10?? 72.66T?? 2.87?? 20.72%?? 24.20%?? 21.13?? 29.14?? -22.28
ADRO IJ ADARO ENERGY TBK 0.59?? 0.01?? 25.11T?? 0.67?? 9.11%?? 3.85%?? 7.10?? 13.77?? -22.87
CPIN IJ CHAROEN POK INDO 1.63?? 191.83?? 47.39T?? 4.27?? 9.42%?? 13.77%?? 24.40?? 37.24?? -23.54
INCO IJ VALE INDONESIA T 2.03?? 0.02?? 27.32T?? 1.17?? 10.82%?? 10.13%?? 11.69?? 12.43?? -24.14
GGRM IJ GUDANG GARAM TBK 1.34?? 3.29k?? 88.41T?? 2.55?? 8.45%?? 16.09%?? 16.61?? 18.20?? -24.30
WIKA IJ WIJAYA KARYA 1.45?? 130.79?? 16.91T?? 4.26?? 5.01%?? 14.38%?? 17.62?? 18.87?? -24.77
PGAS IJ PERUSAHAAN GAS N 2.41?? 0.03?? 104.24T?? 2.63?? 24.33%?? 24.92%?? 19.81?? 37.94?? -26.08
PTBA IJ TAMBANG BATUBARA 1.48?? 737.84?? 20.62T?? 2.40?? 15.16%?? 23.97%?? 18.61?? 31.88?? -26.24
ANTM IJ ANEKA TAMBANG 0.69?? 40.44?? 6.87T?? 0.59?? -2.67%?? -6.16%?? 7.28?? 12.15?? -32.39
ADHI IJ ADHI KARYA 0.47?? 221.20?? 4.00T?? 2.36?? 0.94%?? 20.39%?? 19.77?? 22.45?? -35.45

More Related Content

Total YTD saham LQ45 #saham #ihsg

  • 1. ? MR RIVA KAMAJAYA? The material produced in this document is intended for informational purposes only and should not be construed as an offer or solicitation for the purchase or sale of any financial instrument. The information provided herein reflects current market practices and is not intended to constitute legal, tax, or accounting advice. The information and data contained herein has been obtained from internal data processing, fund administrators as well as other outside sources and, although it is believed to be accurate, no guarantee of completeness or accuracy is being made. Bloomberg LP shall not be liable for any losses or damage that anyone may suffer as a result of relying on this information. The information may be changed by Bloomberg LP at any time. Bloomberg@ Date Printed: ? 06/24/2015? ?-? Page 1 of 2 EQS Ticker Short Name P/S?? BEst EPS Median BF12M?? Market Cap?? P/B?? Net Mrgn 3Yr Avg LF?? ROE LF?? BEst Est ROE Nxt Yr Mean?? 5Yr Avg Adj ROE?? Total Return YTD AKRA IJ AKR CORPORINDO 1.04?? 290.62?? 21.96T?? 3.94?? 4.08%?? 17.62%?? 18.02?? 15.85?? 36.09 UNVR IJ UNILEVER IND TBK 8.96?? 872.48?? 309.02T?? 49.78?? 17.14%?? 99.87%?? 130.71?? 116.21?? 26.69 UNTR IJ UNITED TRACTORS 1.46?? 1.68k?? 75.81T?? 1.97?? 11.11%?? 14.90%?? 14.82?? 22.02?? 20.05 LPPF IJ MATAHARI DEPT 6.27?? 724.31?? 50.77T?? 146.86?? 8.76%?? N.A?? 129.54?? N.A?? 18.07 WSKT IJ WASKITA KARYA PE 1.52?? 69.80?? 23.23T?? 5.68?? 0.69%?? 19.72%?? 16.67?? 23.80?? 16.56 SMRA IJ SUMMARECON AGUNG 4.62?? 97.67?? 24.02T?? 4.29?? 31.08%?? 26.23%?? 21.51?? 22.15?? 10.83 SSMS IJ SAWIT SUMBERMAS 7.35?? 110.97?? 17.19T?? 5.56?? N.A?? 28.81%?? 26.30?? 83.33?? 9.68 MPPA IJ MATAHARI PUTRA P 1.31?? 120.93?? 17.67T?? 6.21?? 2.15%?? 18.71%?? 19.82?? 7.63?? 8.73 LPKR IJ LIPPO KARAWACI 2.17?? 77.18?? 25.15T?? 1.50?? 17.13%?? 16.95%?? 11.32?? 10.89?? 8.49 CTRA IJ CIPUTRA DEVELOPM 3.20?? 100.49?? 20.40T?? 2.75?? 17.01%?? 18.61%?? 17.68?? 11.70?? 7.60 BBCA IJ BANK CENTRAL ASI 6.19?? 811.49?? 337.16T?? 4.23?? 37.45%?? 22.87%?? 20.94?? 25.74?? 4.88 INDF IJ INDOFOOD SUKSES 0.97?? 516.13?? 60.15T?? 2.30?? 6.60%?? 13.42%?? 15.14?? 15.06?? 4.65 TLKM IJ TELEKOMUNIKASI 3.06?? 172.60?? 287.28T?? 3.94?? 17.04%?? 21.82%?? 22.65?? 25.15?? 2.64 PTPP IJ PP PERSERO TBK 1.41?? 169.96?? 17.58T?? 7.07?? 3.70%?? 24.91%?? 25.94?? 21.54?? 2.09 ICBP IJ INDOFOOD CBP SUK 2.47?? 565.91?? 75.22T?? 5.23?? 10.02%?? 19.55%?? 20.42?? 22.27?? 0.07 SILO IJ SILOAM INTERNATI 4.53?? 97.66?? 15.72T?? 9.65?? N.A?? 4.24%?? 6.53?? N.A?? -0.69 BSDE IJ BUMI SERPONG 5.55?? 148.76?? 33.87T?? 1.95?? 49.27%?? 28.78%?? 15.90?? 18.59?? -1.73 ASRI IJ ALAM SUTERA REAL 3.04?? 75.77?? 10.81T?? 1.78?? 37.56%?? 18.65%?? 20.75?? 21.72?? -1.79 BBTN IJ BANK TABUNGAN NE 0.86?? 158.97?? 12.05T?? 0.97?? 22.38%?? 9.88%?? 13.31?? 14.18?? -3.78 BMRI IJ BANK MANDIRI 2.82?? 1.01k?? 234.50T?? 2.28?? 36.83%?? 21.07%?? 19.45?? 22.80?? -5.08 BBRI IJ BANK RAKYAT INDO 2.97?? 1.15k?? 266.43T?? 2.77?? 41.16%?? 27.97%?? 23.27?? 32.09?? -5.21 ASII IJ ASTRA INTERNATIO 1.42?? 500.11?? 276.30T?? 2.80?? 9.19%?? 19.50%?? 18.35?? 28.09?? -6.14 TBIG IJ TOWER BERSAMA 13.02?? 379.41?? 43.41T?? 11.92?? 50.53%?? 28.40%?? 25.94?? 22.13?? -6.70 BBNI IJ BANK NEGARA INDO 2.28?? 679.15?? 103.97T?? 1.75?? 31.37%?? 20.20%?? 18.30?? 17.92?? -6.73 AALI IJ ASTRA AGRO LEST 2.27?? 1.47k?? 34.64T?? 3.09?? 12.99%?? 16.85%?? 18.89?? 26.46?? -7.42 ITMG IJ INDO TAMBANGRAYA 0.61?? 0.14?? 15.14T?? 1.31?? 12.59%?? 15.27%?? 16.44?? 34.13?? -9.39 KLBF IJ KALBE FARMA 4.45?? 53.73?? 76.88T?? 7.86?? 12.43%?? 22.69%?? 23.35?? 25.35?? -9.45 INTP IJ INDOCEMENT TUNGG 3.89?? 1.52k?? 77.40T?? 3.00?? 26.25%?? 21.27%?? 20.26?? 25.00?? -10.84 LSIP IJ PP LONDON SUMATR 2.55?? 125.64?? 10.78T?? 1.54?? 15.30%?? 12.10%?? 12.52?? 20.33?? -13.84 PWON IJ PAKUWON JATI TBK 5.19?? 44.71?? 20.90T?? 3.36?? 39.43%?? 45.61%?? 28.89?? 29.45?? -15.73 BMTR IJ GLOBAL MEDIACOM 1.50?? 95.27?? 16.54T?? 1.41?? 9.79%?? 4.50%?? 12.21?? 9.00?? -16.66
  • 2. ? MR RIVA KAMAJAYA? The material produced in this document is intended for informational purposes only and should not be construed as an offer or solicitation for the purchase or sale of any financial instrument. The information provided herein reflects current market practices and is not intended to constitute legal, tax, or accounting advice. The information and data contained herein has been obtained from internal data processing, fund administrators as well as other outside sources and, although it is believed to be accurate, no guarantee of completeness or accuracy is being made. Bloomberg LP shall not be liable for any losses or damage that anyone may suffer as a result of relying on this information. The information may be changed by Bloomberg LP at any time. Bloomberg@ Date Printed: ? 06/24/2015? ?-? Page 2 of 2 EQS Ticker Short Name P/S?? BEst EPS Median BF12M?? Market Cap?? P/B?? Net Mrgn 3Yr Avg LF?? ROE LF?? BEst Est ROE Nxt Yr Mean?? 5Yr Avg Adj ROE?? Total Return YTD SCMA IJ SURYA CITRA MEDI 10.31?? 123.69?? 40.94T?? 11.07?? 36.33%?? 42.77%?? 43.58?? 50.47?? -18.06 JSMR IJ JASA MARGA 4.29?? 262.90?? 38.42T?? 4.18?? 16.09%?? 14.70%?? 16.88?? 15.65?? -19.04 EXCL IJ XL AXIATA TBK PT 1.41?? 85.73?? 32.88T?? 2.51?? -0.22%?? -14.61%?? 6.57?? 14.28?? -20.86 MNCN IJ MEDIA NUSANTARA 4.09?? 152.87?? 27.48T?? 2.96?? 25.27%?? 19.55%?? 21.56?? 21.17?? -21.97 SMGR IJ SEMEN INDONESIA 2.69?? 988.10?? 72.66T?? 2.87?? 20.72%?? 24.20%?? 21.13?? 29.14?? -22.28 ADRO IJ ADARO ENERGY TBK 0.59?? 0.01?? 25.11T?? 0.67?? 9.11%?? 3.85%?? 7.10?? 13.77?? -22.87 CPIN IJ CHAROEN POK INDO 1.63?? 191.83?? 47.39T?? 4.27?? 9.42%?? 13.77%?? 24.40?? 37.24?? -23.54 INCO IJ VALE INDONESIA T 2.03?? 0.02?? 27.32T?? 1.17?? 10.82%?? 10.13%?? 11.69?? 12.43?? -24.14 GGRM IJ GUDANG GARAM TBK 1.34?? 3.29k?? 88.41T?? 2.55?? 8.45%?? 16.09%?? 16.61?? 18.20?? -24.30 WIKA IJ WIJAYA KARYA 1.45?? 130.79?? 16.91T?? 4.26?? 5.01%?? 14.38%?? 17.62?? 18.87?? -24.77 PGAS IJ PERUSAHAAN GAS N 2.41?? 0.03?? 104.24T?? 2.63?? 24.33%?? 24.92%?? 19.81?? 37.94?? -26.08 PTBA IJ TAMBANG BATUBARA 1.48?? 737.84?? 20.62T?? 2.40?? 15.16%?? 23.97%?? 18.61?? 31.88?? -26.24 ANTM IJ ANEKA TAMBANG 0.69?? 40.44?? 6.87T?? 0.59?? -2.67%?? -6.16%?? 7.28?? 12.15?? -32.39 ADHI IJ ADHI KARYA 0.47?? 221.20?? 4.00T?? 2.36?? 0.94%?? 20.39%?? 19.77?? 22.45?? -35.45