際際滷

際際滷Share a Scribd company logo
Chronicling Latinos diverse experience in a changing America

                   1615 L Street, NW, Suite 700
                      Washington, DC 20036
              202-419-3600(main) 202-419-3608(fax)
                      www.pewhispanic.org
Changing U.S. Demographics
U.S. Hispanic Population
                     Four Decades of Growth
   In millions


                                                50.5


                                     35.3

                              22.4
          14.6


           1980               1990   2000       2010

Source: U.S. Census Bureau.
U.S. Population by Race & Nativity: 2010
        Fastest Growth By Hispanics and Asians
                                      Other,
                   Total U.S.     Population
                                    9.299, 3%    309 million
                                                      Hispanic
                                                     50.5 million
                                                         16%

                                                          Black*
                                                        38 million
                                                           12%
                              White*
                            197 million                    Asian*
                               64%                       14 million
                                                            5%


Source: 2010 U.S. Census.
Ethnic Composition of Latinos, 2010

    Mexican - 31.8                          63.0%

Puerto Rican - 4.6                9.2%

        Cuban - 1.8        3.5%

  Salvadoran - 1.6         3.3%

  Dominican - 1.4          2.8%

 Guatemalan - 1.0          2.1%

  Colombian - 0.9          1.8%

               Other                14.3%

Source: 2010 U.S. Census
Latinos and Identity
Which Term Do You Use
            Most Often to Describe Yourself?


                                            Hispanic/
                                Family's     Latino
                               country of
                                               24%
                                 origin
                                             American
                                      51%
                                                 21%


Source: 2011 National Survey of Latinos
Mixed Views about Identity
 (%) Hispanic versus Latino Preference

                       No Preference                     Hispanic              Latino
                              51                                      33                    14

     Views on a Shared Hispanic Culture
          U.S. Hispanics have many different cultures         U.S. Hispanics share a common culture

                                          69                                       29

      Racial Identification among Latinos
              Some other race             Hispanic/Latino (Vol.)     White       Black/Other
                  26                           25                      36                   10


      Do You Think of Yourself as a Typical American?
                    Typical American                 Very different from typical American
                            47                                         47

Source: 2011 National Survey of Latinos
Which Term Do You Use
            Most Often to Describe Yourself?
     (%)
              Family's country of origin             Hispanic or Latino   American

       All Hispanics                      51                  24          21
  Hispanics
  by generation

                  First                        62                    28        8
              Second                      43             18           35
  Third and higher                28                21             48
Source: 2011 National Survey of Latinos
Which Term Do You Use Most Often to Describe Yourself?
(%)

                                    Country of origin         Hispanic/Latino                American
                     Spanish dominant                         63                                  30         4
                           Foreign born                       62                              28             8
                Less than high school                        57                              30             10
                 High school graduate                        54                         25              18
                         Mexican origin                  52                         26                  19
                                 Bilingual               51                        24                  21
                           All Hispanics                 51                        24                  21
                    Not Mexican origin                   50                        22                  24
                Some college or more                    46                    19                   33
                    Second generation                   43                   18                   35
                             Native born           37                   19                    40
                      English dominant            33               16                        48
         Third and higher generation             28                21                        48

Source: 2011 National Survey of Latinos
Do You Prefer the Term Hispanic or Latino?
(%)
                                             No preference    Hispanic        Latino

                Some college or more                     59               27           13
                      English dominant                  58                    31        10
                     Not Mexican origin                 57               25            17
                    Second generation                55                  28            17
                              Native born            55                   31            14
         Third and higher generation                 53                   36            10
                            All Hispanics           51                   33            14
                                 Bilingual          50               32                18
                 High school graduate               49                   36            14
                            Foreign born            48               35                15
                          Mexican origin            47               38                13
                     Spanish dominant               47               36                14
                 Less than high school             44               38                 16
Source: 2011 National Survey of Latinos
Do You Think of Yourself as a Typical American?
(%)
                 A typical American        Very different from a typical American

                         $75K or more                     70                 28
           Third and higher generation                    69                 27
                      English dominant                   66                 31
                            Native born                  66                 31
                    Second generation                    63                 34
               $30K to less than $75K                  55                 41
                 Some college or more                  54                42
                               Bilingual              50                44
                  High school graduate                50                 47
                    Not Mexican origin                49                45
                          All Hispanics              47                47
                        Mexican origin               45                49
                       Less than $30K                45                48
                 Less than high school             36               54
                          Foreign born            34                58
                     Spanish dominant             31                61

Source: 2011 National Survey of Latinos
Language Use
The Importance of
                             English and Spanish
     (%)

     Do you think adult Hispanic immigrants need to learn English
     To succeed in the U.S.?
                                          Yes            No
                                            87                              11


      How important is it to you that future generations of Hispanics living
      In the U.S. be able to speak Spanish?


               Very/somewhat important           Not too/not at all important

                                          95                            4


Source: 2011 National Survey of Latinos
Primary Language Use among Latinos
     (%)

                           Spanish dominant           Bilingual    English dominant


           All Hispanics                    38                38              24

      Hispanics by generation

                        First                    61                     33         6

                    Second             8          53                     40

     Third and higher              1       29                      69

Source: 2011 National Survey of Latinos
When You Listen to Music,
            Is It Mostly in Spanish or English?
     (%)

                     Mostly in Spanish              Both equally (Vol.)    Mostly in English


              All Hispanics                    35              27                   36


      Hispanics by generation


                         First                      49                    31             18


                     Second               18             26                    54


        Third and higher             10        16                     74

Source: 2011 National Survey of Latinos
When You Watch Television,
            Is It Mostly in Spanish or English?
     (%)

                       Mostly in Spanish         Both equally (Vol.)      Mostly in English


              All Hispanics                28           26                   45


      Hispanics by generation


                         First                  40              34                25


                     Second           12        17                   69


        Third and higher             5 11                       83

Source: 2011 National Survey of Latinos
When You Think,
             Is It Mostly in Spanish or English?
     (%)

                      Mostly in Spanish            Both equally (Vol.)    Mostly in English


              All Hispanics                        45           16              37


      Hispanics by generation


                          First                         65                     18    15


                      Second              18        18                    63


           Third and higher               13   7                     80

Source: 2011 National Survey of Latinos
Latinos and
Their Views of the U.S.
Have Latinos Been More, Less or About
         Equally as Successful as Other Minority
     (%)
                    Groups in the U.S.

                                                    Less
                                      About      successful
                                     equally
                                    successful       22%
                                                    More
                                          55%     successful

                                                      17%


Source: 2011 National Survey of Latinos
Attitudes about Personal Trust
                      and Hard Work
 (%) Would You Say That Most People Can be Trusted or
         That You Cant Be too Careful in Dealing with People
                                    Can be trusted    Can't be too careful
     General population                   35                   61

              All Hispanics                    12                   86

   Can Most People Get Ahead with Hard Work or
     Are Hard Work and Determination No Guarantee of Success?

              Most can get ahead with hard work
              Hard work and determination are no guarantee of success

     General population                                   58                  40

              All Hispanics                          75                  21

Source: 2011 National Survey of Latinos
U.S. Compared to Ancestors
                  Country of Origin in Regard to
     (%)
                                                       Better where
                Better in the U.S.                                      Same
                                                     you/your parents
           The opportunity to get ahead
                                    87                   2              10
           The conditions for raising children
                                          72             10             17
           Treatment of the poor
                                          69             7               21
           The moral values of society
                                               44            21          32
           The strength of family ties
                                                33                39     26

Source: 2011 National Survey of Latinos
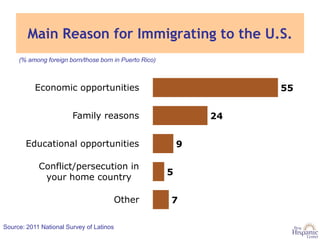
Main Reason for Immigrating to the U.S.
     (% among foreign born/those born in Puerto Rico)


           Economic opportunities                                    55


                        Family reasons                          24


       Educational opportunities                            9

            Conflict/persecution in
                                                        5
             your home country

                                          Other         7

Source: 2011 National Survey of Latinos
If You Could Do It Again, Would You 
     (% among foreign born/those born in Puerto Rico)

             Come to the United States/Leave Puerto Rico for the United States
             Stay in (the country where you were born/Puerto Rico)
             Move to a different country

          All Hispanic immigrants                            79           15         4

      Years in U.S. among Hispanic Immigrants
                 Less than 1 year                       58           33          3
                        to 5 years
                          6-10 years                         80             17       3

                         11-20 years                         82            9     7

               More than 20 years                            83             12 2

Source: 2011 National Survey of Latinos
Chronicling Latinos diverse experience in a changing America

                   1615 L Street, NW, Suite 700
                      Washington, DC 20036
              202-419-3600(main) 202-419-3608(fax)
                      www.pewhispanic.org
Mexican-Born Population
                      in the U.S., 1850-2011
     (in millions)
                                                                 2009
       14                                                        12.6

       12                                                                 2011
                                                                          12.0
       10

         8

         6

         4
                                                          1970
         2                                                0.8


         0
          1850       1870     1890   1910   1930   1950      1970       1990     2011
                                                                                 2010
Source: Pew Hispanic Center
More Related Content

Reaching latinos online meetup lopez 2012_

  • 1. Chronicling Latinos diverse experience in a changing America 1615 L Street, NW, Suite 700 Washington, DC 20036 202-419-3600(main) 202-419-3608(fax) www.pewhispanic.org
  • 3. U.S. Hispanic Population Four Decades of Growth In millions 50.5 35.3 22.4 14.6 1980 1990 2000 2010 Source: U.S. Census Bureau.
  • 4. U.S. Population by Race & Nativity: 2010 Fastest Growth By Hispanics and Asians Other, Total U.S. Population 9.299, 3% 309 million Hispanic 50.5 million 16% Black* 38 million 12% White* 197 million Asian* 64% 14 million 5% Source: 2010 U.S. Census.
  • 5. Ethnic Composition of Latinos, 2010 Mexican - 31.8 63.0% Puerto Rican - 4.6 9.2% Cuban - 1.8 3.5% Salvadoran - 1.6 3.3% Dominican - 1.4 2.8% Guatemalan - 1.0 2.1% Colombian - 0.9 1.8% Other 14.3% Source: 2010 U.S. Census
  • 7. Which Term Do You Use Most Often to Describe Yourself? Hispanic/ Family's Latino country of 24% origin American 51% 21% Source: 2011 National Survey of Latinos
  • 8. Mixed Views about Identity (%) Hispanic versus Latino Preference No Preference Hispanic Latino 51 33 14 Views on a Shared Hispanic Culture U.S. Hispanics have many different cultures U.S. Hispanics share a common culture 69 29 Racial Identification among Latinos Some other race Hispanic/Latino (Vol.) White Black/Other 26 25 36 10 Do You Think of Yourself as a Typical American? Typical American Very different from typical American 47 47 Source: 2011 National Survey of Latinos
  • 9. Which Term Do You Use Most Often to Describe Yourself? (%) Family's country of origin Hispanic or Latino American All Hispanics 51 24 21 Hispanics by generation First 62 28 8 Second 43 18 35 Third and higher 28 21 48 Source: 2011 National Survey of Latinos
  • 10. Which Term Do You Use Most Often to Describe Yourself? (%) Country of origin Hispanic/Latino American Spanish dominant 63 30 4 Foreign born 62 28 8 Less than high school 57 30 10 High school graduate 54 25 18 Mexican origin 52 26 19 Bilingual 51 24 21 All Hispanics 51 24 21 Not Mexican origin 50 22 24 Some college or more 46 19 33 Second generation 43 18 35 Native born 37 19 40 English dominant 33 16 48 Third and higher generation 28 21 48 Source: 2011 National Survey of Latinos
  • 11. Do You Prefer the Term Hispanic or Latino? (%) No preference Hispanic Latino Some college or more 59 27 13 English dominant 58 31 10 Not Mexican origin 57 25 17 Second generation 55 28 17 Native born 55 31 14 Third and higher generation 53 36 10 All Hispanics 51 33 14 Bilingual 50 32 18 High school graduate 49 36 14 Foreign born 48 35 15 Mexican origin 47 38 13 Spanish dominant 47 36 14 Less than high school 44 38 16 Source: 2011 National Survey of Latinos
  • 12. Do You Think of Yourself as a Typical American? (%) A typical American Very different from a typical American $75K or more 70 28 Third and higher generation 69 27 English dominant 66 31 Native born 66 31 Second generation 63 34 $30K to less than $75K 55 41 Some college or more 54 42 Bilingual 50 44 High school graduate 50 47 Not Mexican origin 49 45 All Hispanics 47 47 Mexican origin 45 49 Less than $30K 45 48 Less than high school 36 54 Foreign born 34 58 Spanish dominant 31 61 Source: 2011 National Survey of Latinos
  • 14. The Importance of English and Spanish (%) Do you think adult Hispanic immigrants need to learn English To succeed in the U.S.? Yes No 87 11 How important is it to you that future generations of Hispanics living In the U.S. be able to speak Spanish? Very/somewhat important Not too/not at all important 95 4 Source: 2011 National Survey of Latinos
  • 15. Primary Language Use among Latinos (%) Spanish dominant Bilingual English dominant All Hispanics 38 38 24 Hispanics by generation First 61 33 6 Second 8 53 40 Third and higher 1 29 69 Source: 2011 National Survey of Latinos
  • 16. When You Listen to Music, Is It Mostly in Spanish or English? (%) Mostly in Spanish Both equally (Vol.) Mostly in English All Hispanics 35 27 36 Hispanics by generation First 49 31 18 Second 18 26 54 Third and higher 10 16 74 Source: 2011 National Survey of Latinos
  • 17. When You Watch Television, Is It Mostly in Spanish or English? (%) Mostly in Spanish Both equally (Vol.) Mostly in English All Hispanics 28 26 45 Hispanics by generation First 40 34 25 Second 12 17 69 Third and higher 5 11 83 Source: 2011 National Survey of Latinos
  • 18. When You Think, Is It Mostly in Spanish or English? (%) Mostly in Spanish Both equally (Vol.) Mostly in English All Hispanics 45 16 37 Hispanics by generation First 65 18 15 Second 18 18 63 Third and higher 13 7 80 Source: 2011 National Survey of Latinos
  • 19. Latinos and Their Views of the U.S.
  • 20. Have Latinos Been More, Less or About Equally as Successful as Other Minority (%) Groups in the U.S. Less About successful equally successful 22% More 55% successful 17% Source: 2011 National Survey of Latinos
  • 21. Attitudes about Personal Trust and Hard Work (%) Would You Say That Most People Can be Trusted or That You Cant Be too Careful in Dealing with People Can be trusted Can't be too careful General population 35 61 All Hispanics 12 86 Can Most People Get Ahead with Hard Work or Are Hard Work and Determination No Guarantee of Success? Most can get ahead with hard work Hard work and determination are no guarantee of success General population 58 40 All Hispanics 75 21 Source: 2011 National Survey of Latinos
  • 22. U.S. Compared to Ancestors Country of Origin in Regard to (%) Better where Better in the U.S. Same you/your parents The opportunity to get ahead 87 2 10 The conditions for raising children 72 10 17 Treatment of the poor 69 7 21 The moral values of society 44 21 32 The strength of family ties 33 39 26 Source: 2011 National Survey of Latinos
  • 23. Main Reason for Immigrating to the U.S. (% among foreign born/those born in Puerto Rico) Economic opportunities 55 Family reasons 24 Educational opportunities 9 Conflict/persecution in 5 your home country Other 7 Source: 2011 National Survey of Latinos
  • 24. If You Could Do It Again, Would You (% among foreign born/those born in Puerto Rico) Come to the United States/Leave Puerto Rico for the United States Stay in (the country where you were born/Puerto Rico) Move to a different country All Hispanic immigrants 79 15 4 Years in U.S. among Hispanic Immigrants Less than 1 year 58 33 3 to 5 years 6-10 years 80 17 3 11-20 years 82 9 7 More than 20 years 83 12 2 Source: 2011 National Survey of Latinos
  • 25. Chronicling Latinos diverse experience in a changing America 1615 L Street, NW, Suite 700 Washington, DC 20036 202-419-3600(main) 202-419-3608(fax) www.pewhispanic.org
  • 26. Mexican-Born Population in the U.S., 1850-2011 (in millions) 2009 14 12.6 12 2011 12.0 10 8 6 4 1970 2 0.8 0 1850 1870 1890 1910 1930 1950 1970 1990 2011 2010 Source: Pew Hispanic Center