The Power of 2D Stacked Charts in Business Communication
Download as PPTX, PDF0 likes282 views

The document discusses the power of 2D stacked charts, also known as Marimekko or Mekko charts, for business communication and data visualization. It provides three examples of 2D stacked charts showing: (1) sales by channel and company, (2) product mix across retail outlets, and (3) market share of a financial product across states in Australia. The charts were created using an Excel macro that can build 2D stacked charts in both Windows and Mac versions of Excel.
The Power of 2D Stacked Charts in Business Communication
- 1. The Power of 2D Stacked Charts in Business Communication Cyrille R. Bouzy 2012
- 2. 2D stacked chart = ideal tool to show sales data •Sometimes called Marimekko or Mekko chart •Introduced by strategy consultants in the 1970’s to represent any quantitative data along two dimensions. For instance: – Sales by product and channel – Sales by region and country – Market share by area and company •Images are more powerful than words! 2D Stacked Charts – Copyright Cerebel Consulting 2012 © 1
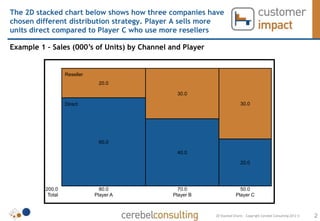
- 3. The 2D stacked chart below shows how three companies have chosen different distribution strategy. Player A sells more units direct compared to Player C who use more resellers Example 1 – Sales (000’s of Units) by Channel and Player Reseller 20.0 30.0 Direct 30.0 60.0 40.0 20.0 200.0 80.0 70.0 50.0 Total Player A Player B Player C 2D Stacked Charts – Copyright Cerebel Consulting 2012 © 2
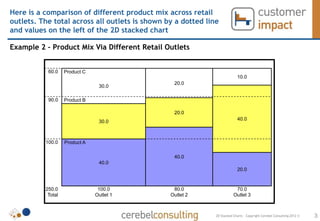
- 4. Here is a comparison of different product mix across retail outlets. The total across all outlets is shown by a dotted line and values on the left of the 2D stacked chart Example 2 – Product Mix Via Different Retail Outlets 60.0 Product C 10.0 20.0 30.0 90.0 Product B 20.0 40.0 30.0 100.0 Product A 40.0 40.0 20.0 250.0 100.0 80.0 70.0 Total Outlet 1 Outlet 2 Outlet 3 2D Stacked Charts – Copyright Cerebel Consulting 2012 © 3
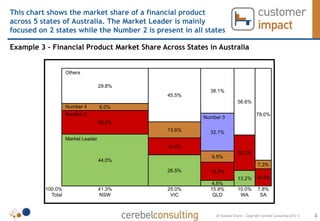
- 5. This chart shows the market share of a financial product across 5 states of Australia. The Market Leader is mainly focused on 2 states while the Number 2 is present in all states Example 3 – Financial Product Market Share Across States in Australia Others 29.8% 38.1% 45.5% 56.6% Number 4 6.0% Number 2 78.0% Number 3 20.2% 13.6% 32.1% Market Leader 14.4% 30.2% 9.5% 44.0% 7.3% 26.5% 15.5% 13.2% 14.6% 4.8% 100.0% 41.3% 25.0% 15.9% 10.0% 7.8% Total NSW VIC QLD WA SA 2D Stacked Charts – Copyright Cerebel Consulting 2012 © 4
- 6. Boost your business communication Try our Excel macro •These three examples of 2D stacked charts were built using a simple Excel macro •Compatible with both Microsoft Excel for Windows 2010 and Mac 2011 Visit our store at: http://www.cerebelconsulting.com/store/customer-tools/2d-stacked-chart 2D Stacked Charts – Copyright Cerebel Consulting 2012 © 5