Comprehensive financial analysis
Download as PPTX, PDF0 likes195 views

This document outlines a comprehensive financial analysis method using ratios to evaluate a company's performance. It examines ratios related to operating efficiency, financial leverage, liquidity, and profitability to identify strengths and weaknesses. Specifically, it analyzes return on net assets (RONA), weighted average cost of capital (WACC), earnings before interest and taxes (EBIT), gross and operating margins, asset turnover, operating ratios, and how ratios can forecast future prospects. The conclusion reiterates that this method allows for a thorough analysis of a company's past and current performance or the potential impact of strategies being considered.

Comprehensive financial analysis
- 2. What is it for… • Comprehensive financial analysis accentuate the strengths and weaknesses of a company. Communicating the company’s strengths and weaknesses in an accurate and honest manner is helpful in convincing the investors to invest in your business
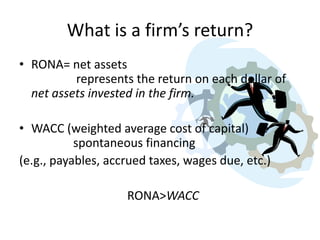
- 3. What is a firm’s return? • RONA= net assets represents the return on each dollar of net assets invested in the firm. • WACC (weighted average cost of capital) spontaneous financing (e.g., payables, accrued taxes, wages due, etc.) RONA>WACC
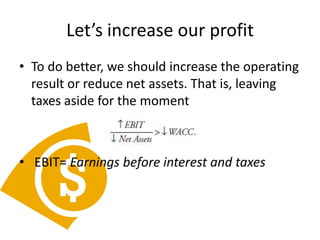
- 4. Let’s increase our profit • To do better, we should increase the operating result or reduce net assets. That is, leaving taxes aside for the moment • EBIT= Earnings before interest and taxes
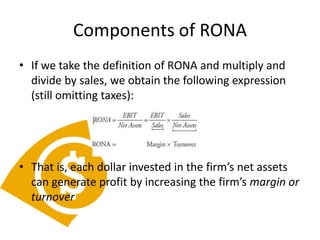
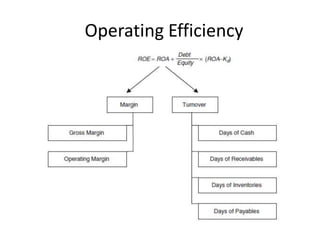
- 5. Components of RONA • If we take the definition of RONA and multiply and divide by sales, we obtain the following expression (still omitting taxes): • That is, each dollar invested in the firm’s net assets can generate profit by increasing the firm’s margin or turnover
- 6. Evolution of margin • We may obtain some relevant conclusions by simply comparing the evolution of gross margin and operating margin. Example, if gross margin is exhibiting the expected progress but operating margin is getting behind (or falling), then we could conclude that there may be problems in the firm’s fixed cost structure (or, at least, that there is some cost associated with the chosen strategy).
- 7. Asset turnover • What actually has to turn over are the components included in net operating investment: cash holdings, account receivables, inventory, and/or, as part of the net effect, payables. • So, to analyze a firm’s potential success or failure in turning assets over, we could look at the operating ratios; namely, days of cash, days of receivables, days of inventory, and days of payables. In this way, we can uncover where our assets may be gaining weight and we can determine if the extra investment is being productive
- 9. A forecast • In addition to helping an investor, analyst, or manager understand a firm’s past or current performance, ratios can be used to forecast a firm’s prospects. For example, ratios can be used by a manager who is considering whether to adopt a new growth strategy
- 10. Conclusion • This chapter presented a method for conducting a comprehensive analysis of a firm’s financial performance based on traditional financial ratios. • We first introduced the primary ratios related to operating efficiency, financial leverage, liquidity, and profitability. We then showed how these ratios and their components can be used to answer important questions about a firm’s past or current performance or about a firm’s future prospects. Following this analysis, a manager can evaluate the impact of the firm’s overall business and financial strategy on shareholders’ profits, or can determine whether a strategy under consideration is likely to add to such profi ts.