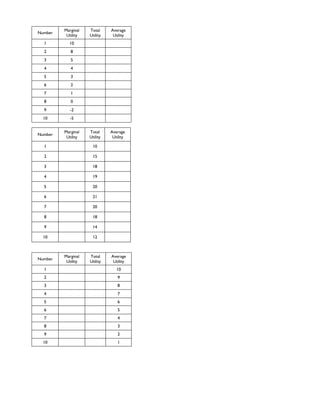
Margin total average table
- 1. Number Marginal Utility Total Utility Average Utility 1 10 2 8 3 5 4 4 5 3 6 2 7 1 8 0 9 -2 10 -5 ! Number Marginal Utility Total Utility Average Utility 1 10 2 15 3 18 4 19 5 20 6 21 7 20 8 18 9 14 10 12 !! Number Marginal Utility Total Utility Average Utility 1 10 2 9 3 8 4 7 5 6 6 5 7 4 8 3 9 2 10 1 !

