Access customers with Echosec Business Intelligence
0 likes95 views

Geofencing allows users to define a virtual boundary around a real-world geographic area. Within this boundary, users can gather social media posts, news, and other online data through APIs to analyze topics like brands, events, and economic conditions. The tool tracks location data from social networks to provide context on situations within the geofenced areas. Financial analysts use it to monitor regions and get insights faster to help with investment decisions.
Access customers with Echosec Business Intelligence
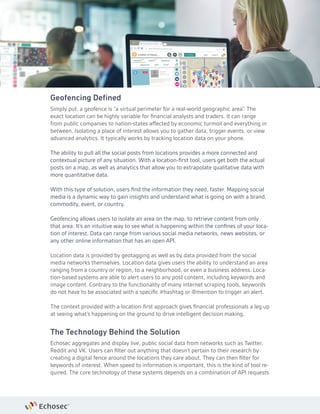
- 3. Geofencing Defined Simply put, a geofence is âa virtual perimeter for a real-world geographic areaâ. The exact location can be highly variable for financial analysts and traders. It can range from public companies to nation-states affected by economic turmoil and everything in between. Isolating a place of interest allows you to gather data, trigger events, or view advanced analytics. It typically works by tracking location data on your phone. The ability to pull all the social posts from locations provides a more connected and contextual picture of any situation. With a location-first tool, users get both the actual posts on a map, as well as analytics that allow you to extrapolate qualitative data with more quantitative data. With this type of solution, users find the information they need, faster. Mapping social media is a dynamic way to gain insights and understand what is going on with a brand, commodity, event, or country. Geofencing allows users to isolate an area on the map, to retrieve content from only that area. Itâs an intuitive way to see what is happening within the confines of your loca- tion of interest. Data can range from various social media networks, news websites, or any other online information that has an open API. Location data is provided by geotagging as well as by data provided from the social media networks themselves. Location data gives users the ability to understand an area ranging from a country or region, to a neighborhood, or even a business address. Loca- tion-based systems are able to alert users to any post content, including keywords and image content. Contrary to the functionality of many internet scraping tools, keywords do not have to be associated with a specific #hashtag or @mention to trigger an alert. The context provided with a location-first approach gives financial professionals a leg up at seeing whatâs happening on the ground to drive intelligent decision making. The Technology Behind the Solution Echosec aggregates and display live, public social data from networks such as Twitter, Reddit and VK. Users can filter out anything that doesnât pertain to their research by creating a digital fence around the locations they care about. They can then filter for keywords of interest. When speed to information is important, this is the kind of tool re- quired. The core technology of these systems depends on a combination of API requests
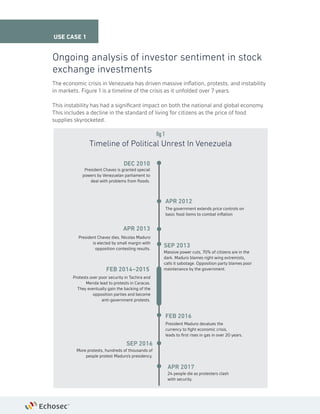
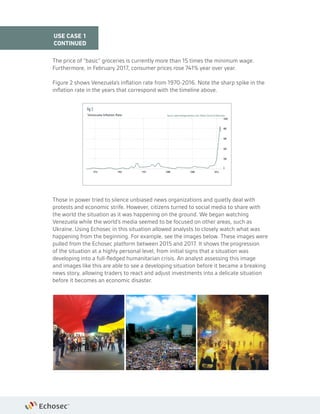
- 6. The price of âbasicâ groceries is currently more than 15 times the minimum wage. Furthermore, in February 2017, consumer prices rose 741% year over year. Figure 2 shows Venezuelaâs inflation rate from 1970-2016. Note the sharp spike in the inflation rate in the years that correspond with the timeline above. Those in power tried to silence unbiased news organizations and quietly deal with protests and economic strife. However, citizens turned to social media to share with the world the situation as it was happening on the ground. We began watching Venezuela while the worldâs media seemed to be focused on other areas, such as Ukraine. Using Echosec in this situation allowed analysts to closely watch what was happening from the beginning. For example, see the images below. These images were pulled from the Echosec platform between 2015 and 2017. It shows the progression of the situation at a highly personal level, from initial signs that a situation was developing into a full-fledged humanitarian crisis. An analyst assessing this image and images like this are able to see a developing situation before it became a breaking news story, allowing traders to react and adjust investments into a delicate situation before it becomes an economic disaster. USE CASE 1 CONTINUED Venezuela Inflation Rate 1976 1000 800 600 400 200 0 1984 1992 2000 2008 2016 Source: www.tradingeconomics.com | Banco Central de Venezuela fig 2
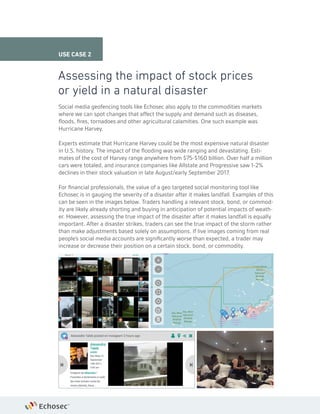
- 7. Social media geofencing tools like Echosec also apply to the commodities markets where we can spot changes that affect the supply and demand such as diseases, floods, fires, tornadoes and other agricultural calamities. One such example was Hurricane Harvey. Experts estimate that Hurricane Harvey could be the most expensive natural disaster in U.S. history. The impact of the flooding was wide ranging and devastating. Esti- mates of the cost of Harvey range anywhere from $75-$160 billion. Over half a million cars were totaled, and insurance companies like Allstate and Progressive saw 1-2% declines in their stock valuation in late August/early September 2017. For financial professionals, the value of a geo targeted social monitoring tool like Echosec is in gauging the severity of a disaster after it makes landfall. Examples of this can be seen in the images below. Traders handling a relevant stock, bond, or commod- ity are likely already shorting and buying in anticipation of potential impacts of weath- er. However, assessing the true impact of the disaster after it makes landfall is equally important. After a disaster strikes, traders can see the true impact of the storm rather than make adjustments based solely on assumptions. If live images coming from real peopleâs social media accounts are significantly worse than expected, a trader may increase or decrease their position on a certain stock, bond, or commodity. Assessing the impact of stock prices or yield in a natural disaster USE CASE 2