Knowing your customer for circulation
- 1. Knowing your customer: the budget-free approach to geodemographics and creating your customer profile Stephen Fraser
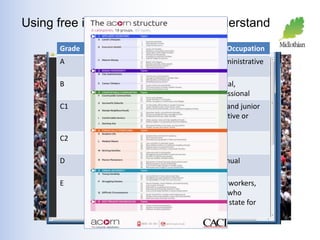
- 2. Using free information sources to understand your customer Grade Social Class Chief Income Earner’s Occupation A Upper Middle Class Higher Managerial, administrative or professional B Middle Class Intermediate managerial, administrative or professional C1 Lower Middle Class Supervisory or clerical and junior managerial, administrative or professional C2 Skilled Working Class Skilled manual workers D Working Class Semi and unskilled manual workers E Non-working Casual or lowest grade workers, pensioners and others who depend on the welfare state for their income
- 6. National Sources of help Scotland’s Census Results Online – Scrol browser Scotland’s Census 2011 Scottish Neighbourhood Statistics
- 7. Liberating data you already hold
- 10. Thank you. • www.opengeodemographics.com • www.public.cdrc.ac.uk • www.scrol.gov.uk/scrol/browser/profile.jsp Stephen Fraser Scfraser99 on Twitter LinkedIn
Editor's Notes
- #3: Today is, of course, a conference on Channel Shift and my contribution today will be about the knowledge you can gain for nothing to help you persuade people to move how they contact you. It’s about using what you have already to understand your service users better and improve the chances of successful change. Better customer insight helps you spend time and perhaps money wisely. So how can you learn about the people in your area? We’re all familiar with the idea that somewhere out there details of our everyday lives are being collated and held by various agencies and organisations. The people doing that might be retailers – Tesco’s Clubcard has 16m members. Or they might be government agencies. We’re all probably dimly aware of attempts in the past, most famously the National Readership Survey, to put people in categories. This is the famous ABC 1 scale. Acorn is the latest development of the ABC1 scale. Geodemographics is based on the premise that similar people do similar things and live in similar locations.
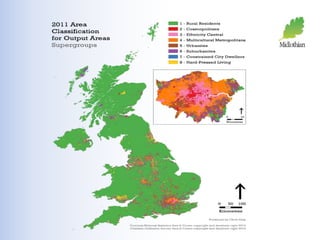
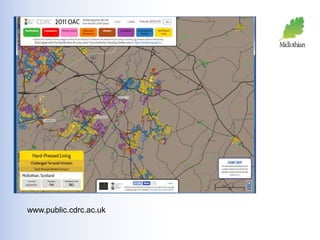
- #4: But what’s this to do with local authorities, charities, or other organisations? Umm, we can. The decision to make Census information available to all has unlocked data and academics and others, like me, are moving now to take advantage to improve the insight we have on our communities. Thanks to Chris Gale, who is the expert in this area, for this illustration. The Office of National Statistics and University College London released details from the 2011 Census in July 2014. This information is based on what are known as Open Area Classifications, which are bigger than postcode areas and roughly have around 272 people in each one. Midlothian has 710 OAC datazones, created by clustering similar people together. The clustering is done by assessing 60 variables for people, such as employment, age, housing tenure, size of household etc. If you know the datazone, you can find the postcodes in each one, and vice versa as these are all available in Excel or CSV format. The free Open Area Classifications also has its own set of groupings. The eight top level classes are shown top right.
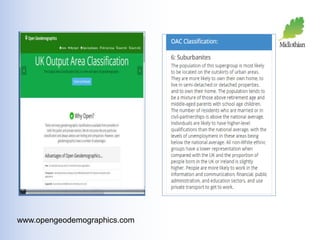
- #5: Free to use maps and other tools are available using this core data. You can enter your postcode at www.opengeodemographics.com and see if you agree with the descriptions given of people who live in your street. Here’s one I did earlier, for me. It says I’m more likely to live in a semi-detached and own my home. The population tends to be a mix of people above retirement age and middle-aged parents with school age kids. Ouch, but true. People are more likely to work in information and communication or public administration and use private transport to get to work. It’s spot on for my coastal town in East Lothian. I live in North Berwick and most of my neighbours are retired.
- #6: The core data is also visualised at another website, www.public.cdrc.ac.uk. This view shows you the northern parts of Midlothian. The three most prevalent groupings in Midlothian are: Hard Pressed Renters (16,915 of our 83,000 population) Challenged Transitionaries (6,036 of our 83,000) Self-sufficient retirement (4,570 of our 83,000 and fast growing).
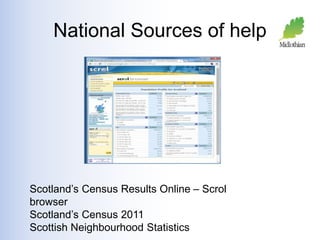
- #7: If you would like more data, drawn from the same source, then Scotland’s Census Results Online – the Scrol browser is the place to go. This is good for 2001 data. 2011 data is at Scotland’s Census 2011. The data is available for download through the Data Warehouse. This allows you to add your own information alongside national information. What this resource doesn’t have, however, will be the full picture of your customer.
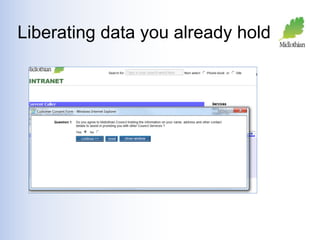
- #8: What do you have and know better than anyone else? Every local authority has reams of information on individuals, offered by them, every day of the year. They call us, they email us, they tweet us, some of them still even write in! We’ve got details from Council tax, from Academy, from Revenues and Benefits, from Uniform used in Community Safety, from social work, from Education, from libraries. Now clearly there are some of our databases which we need to protect and I am not and would not advocate any potential risks being taken with social work or education databases. However that still leaves lots of useful data that the Council can use as long as the consent of the person involved has been recorded. This is the record we use to collect consents in our Contact Centre for council use, with a second question being asked to allow us to share the information with our Community Planning partners. The trick is to combine the information available at national level with the information held by the local authority.
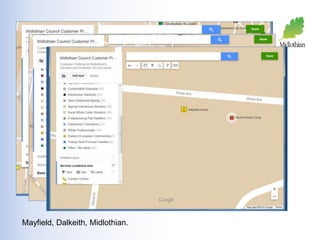
- #9: So how you compile this information, and harder still, how do you display that information in a way which helps people decide on changes to make? This data used to require specialists to access it and specialists to display it. Now, what you need is Google Maps, Microsoft Excel (or another spreadsheet solution), a browser, an idea of where to look and who to speak to, and a friendly colleague or two who know how to get information out of your organisation’s client relationship management systems. What you’re now seeing on the screen is a Google Map which combines the census-provided information on people in Midlothian with the council’s information on these people’s usage of our Contact Centre, searching specifically for a location in Mayfield, Dalkeith. (Click) Zooming in tighter, you’ll see people in this particular datazone call our contact centre quite frequently and have a strong preference for face to face contact. Now I’ve overlaid that location with details of where we currently have libraries. You’ll see we have a library in that area. We’re now exploring a pilot in that area to divert contact by transforming this library into a small scale customer service access point. So how did I create the map? I downloaded the OAC classifications, together with a tool that allows you to match OAC zones with longitude and latitude information. A colleague used a system called Biquery to get details on calls and callers from our Client Relationship system. I used this data to find out the number of calls per postcode and OAC datazones through simple filtering and formulae on Excel and then created a spreadsheet which gives the information you see here. I uploaded that database to Google Maps. I got the Channel Preference data from an aggregate of publicly available sources, such as the Improvement Service in Scotland.
- #10: Insight helps you understand your customers and their behaviours. For all this is an amorphous crowd, it’s segmented by interest and behaviour – it’s a group of people at a music concert. From a marketing perspective, insight allows us to target people better and minimise waste on spend. From a service delivery perspective, insight allows us to understand who is most likely to interact with us digitally, and who just won’t. It helps us gauge how much assistance is likely to be needed by our residents to access services if we tweak delivery towards less expensive ways. The big picture is that we know that around 10% to 15% of our residents need help to access services and that proportion is unlikely to change. That’s fine, that’s our social mission. The Mayfield hub is a partial example of Channel Shift – by offering face to face routes to people with a strong preference for face to face, we’re hopeful for a decrease in the number of calls and other contact from this area and the establishment of stronger links with people we know could benefit from our help. To fund this level of assistance, through libraries, adult learning, or other models, we’re looking at the remaining 80% – 85% to see where contact can be moved in a way that’s acceptable to our customer or resident. By mapping our customers into segmented groups, we move closer, ironically, to treating them as individuals and away from a one size–fits-all model, using the “free” data sources we already have in place. And by having insight in place, we move hopefully closer to the shift we want to see.

