Bi dutch meeting data science
0 likes791 views

Presentation at the BI dutch meeting on June 27
Bi dutch meeting data science
- 1. ŌĆśEnkele voorbeeldenŌĆÖ Data Science, Big Data en de offici├½le statistiek Piet Daas, Edwin de Jonge, May Offermans, Martijn Tennekes Alex Priem en Paul van den Hurk
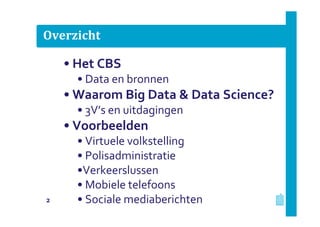
- 2. Overzicht 2 ŌĆó Het CBS ŌĆó Data en bronnen ŌĆó Waarom Big Data & Data Science? ŌĆó 3VŌĆÖs en uitdagingen ŌĆó Voorbeelden ŌĆó Virtuele volkstelling ŌĆó Polisadministratie ŌĆóVerkeerslussen ŌĆó Mobiele telefoons ŌĆó Sociale mediaberichten
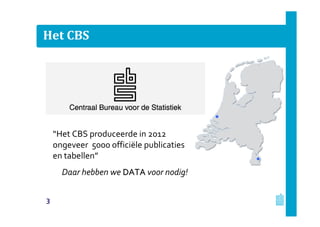
- 3. Het CBS ŌĆ£Het CBS produceerde in 2012 ongeveer 5000 offici├½le publicaties en tabellenŌĆØ Daar hebben we DATADATA voor nodig! 3
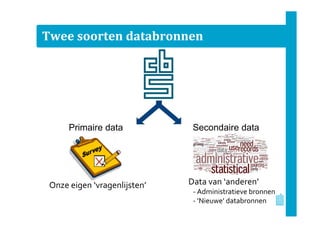
- 4. Twee soorten databronnen Primaire data Secondaire data Onze eigen ŌĆśvragenlijstenŌĆÖ Data van ŌĆśanderenŌĆÖ - Administratieve bronnen - ŌĆśNieuweŌĆÖ databronnen
- 5. ŌĆōŌĆō Data, data everywhere!Data, data everywhere! X
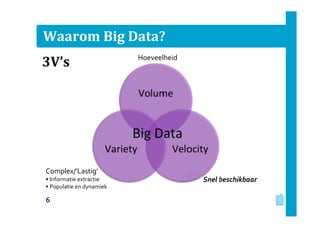
- 6. Waarom Big Data? Snel beschikbaar Hoeveelheid Complex/ŌĆÖLastigŌĆÖ ŌĆó Informatie extractie ŌĆó Populatie en dynamiek 6 3VŌĆÖs
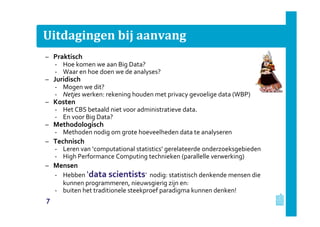
- 7. Uitdagingen bij aanvang ŌĆō Praktisch ŌĆÉ Hoe komen we aan Big Data? ŌĆÉ Waar en hoe doen we de analyses? ŌĆō Juridisch ŌĆÉ Mogen we dit? ŌĆÉ Netjes werken: rekening houden met privacy gevoelige data (WBP) ŌĆō Kosten ŌĆÉ Het CBS betaald niet voor administratieve data. ŌĆÉ En voor Big Data? ŌĆō Methodologisch ŌĆÉ Methoden nodig om grote hoeveelheden data te analyseren ŌĆō Technisch ŌĆÉ Leren van ŌĆścomputational statisticsŌĆÖ gerelateerde onderzoeksgebieden ŌĆÉ High Performance Computing technieken (parallelle verwerking) ŌĆō Mensen ŌĆÉ Hebben ŌĆśdata scientistsŌĆÖ nodig: statistisch denkende mensen die kunnen programmeren, nieuwsgierig zijn en: ŌĆÉ buiten het traditionele steekproef paradigma kunnen denken! 7
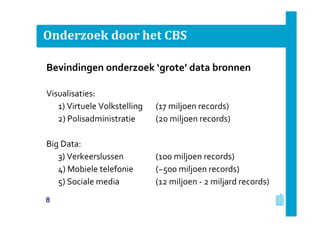
- 8. Onderzoek door het CBS Bevindingen onderzoek ŌĆśgroteŌĆÖ data bronnen Visualisaties: 1) Virtuele Volkstelling (17 miljoen records) 2) Polisadministratie (20 miljoen records) Big Data: 3) Verkeerslussen (100 miljoen records) 4) Mobiele telefonie (~500 miljoen records) 5) Sociale media (12 miljoen - 2 miljard records) 8
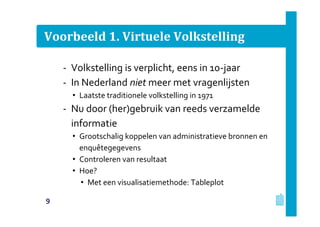
- 9. Voorbeeld 1. Virtuele Volkstelling ŌĆÉ Volkstelling is verplicht, eens in 10-jaar ŌĆÉ In Nederland niet meer met vragenlijsten ŌĆó Laatste traditionele volkstelling in 1971 ŌĆÉ Nu door (her)gebruik van reeds verzamelde informatie ŌĆó Grootschalig koppelen van administratieve bronnen en enqu├¬tegegevens ŌĆó Controleren van resultaat ŌĆó Hoe? ŌĆó Met een visualisatiemethode: Tableplot 9
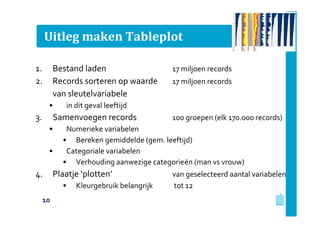
- 10. Uitleg maken Tableplot 1. Bestand laden 17 miljoen records 2. Records sorteren op waarde 17 miljoen records van sleutelvariabele ŌĆó in dit geval leeftijd 3. Samenvoegen records 100 groepen (elk 170.000 records) ŌĆó Numerieke variabelen ŌĆó Bereken gemiddelde (gem. leeftijd) ŌĆó Categoriale variabelen ŌĆó Verhouding aanwezige categorie├½n (man vs vrouw) 4. Plaatje ŌĆśplottenŌĆÖ van geselecteerd aantal variabelen ŌĆó Kleurgebruik belangrijk tot 12 10
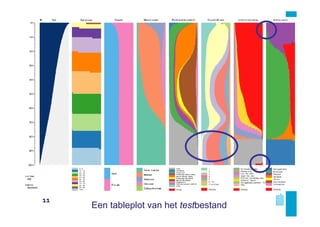
- 11. Een tableplot van het testbestand 11
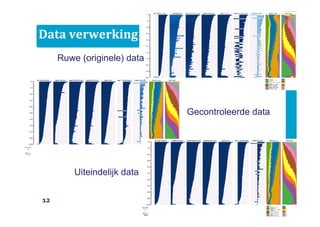
- 12. Data verwerking Ruwe (originele) data Gecontroleerde data Uiteindelijk data 12
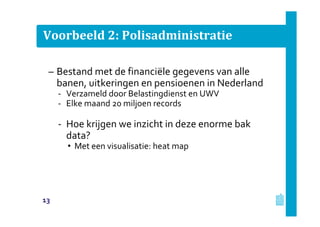
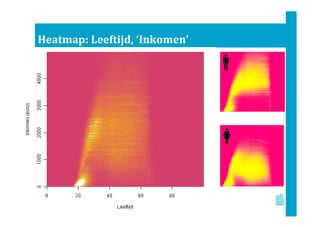
- 13. Voorbeeld 2: Polisadministratie ŌĆō Bestand met de financi├½le gegevens van alle banen, uitkeringen en pensioenen in Nederland ŌĆÉ Verzameld door Belastingdienst en UWV ŌĆÉ Elke maand 20 miljoen records ŌĆÉ Hoe krijgen we inzicht in deze enorme bak data? ŌĆó Met een visualisatie: heat map 13
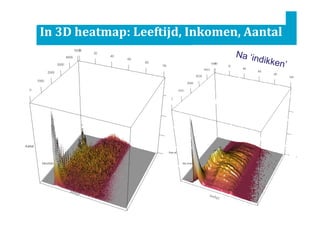
- 15. leeftijd In 3D heatmap: Leeftijd, Inkomen, Aantal Na ŌĆśindikkenŌĆÖ leeftijd
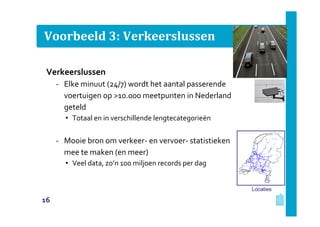
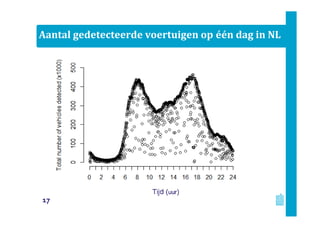
- 16. Voorbeeld 3: Verkeerslussen Verkeerslussen ŌĆÉ Elke minuut (24/7) wordt het aantal passerende voertuigen op >10.000 meetpunten in Nederland geteld ŌĆó Totaal en in verschillende lengtecategorie├½n ŌĆÉ Mooie bron om verkeer- en vervoer- statistieken mee te maken (en meer) ŌĆó Veel data, zoŌĆÖn 100 miljoen records per dag Locaties 16
- 17. Aantal gedetecteerde voertuigen op ├®├®n dag in NL 17
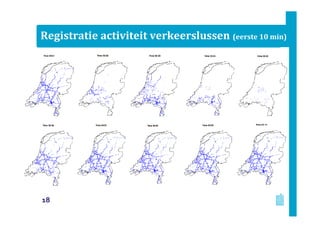
- 18. Registratie activiteit verkeerslussen (eerste 10 min) 18
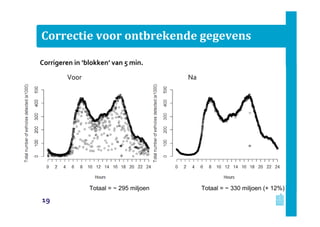
- 19. Correctie voor ontbrekende gegevens Corrigeren in ŌĆśblokkenŌĆÖ van 5 min. Voor Na Totaal = ~ 295 miljoen Totaal = ~ 330 miljoen (+ 12%) 19
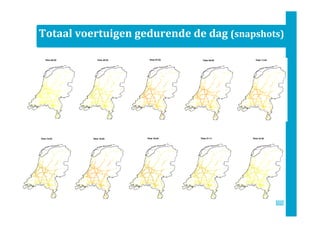
- 20. Totaal voertuigen gedurende de dag (snapshots)
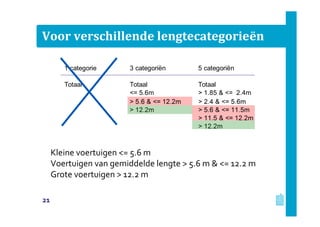
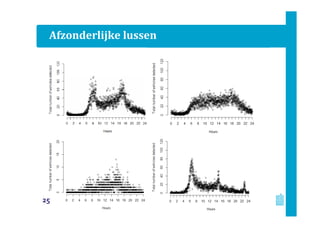
- 21. Voor verschillende lengtecategorieën Kleine voertuigen <= 5.6 m Voertuigen van gemiddelde lengte > 5.6 m & <= 12.2 m Grote voertuigen > 12.2 m 1 categorie 3 categoriën 5 categoriën Totaal Totaal Totaal <= 5.6m > 1.85 & <= 2.4m > 5.6 & <= 12.2m > 2.4 & <= 5.6m > 12.2m > 5.6 & <= 11.5m > 11.5 & <= 12.2m > 12.2m 21
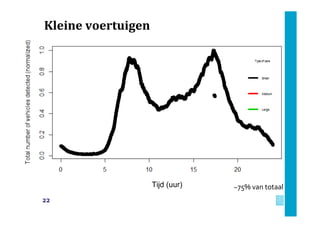
- 22. Kleine voertuigen Tijd (uur) ~75% van totaal 22
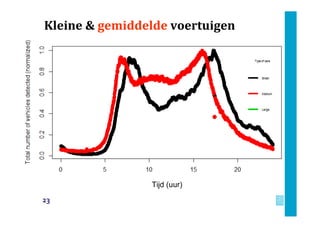
- 23. Kleine & gemiddelde voertuigen Tijd (uur) 23
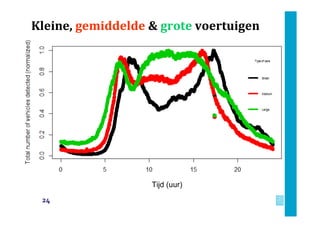
- 24. Kleine, gemiddelde & grote voertuigen Tijd (uur) 24
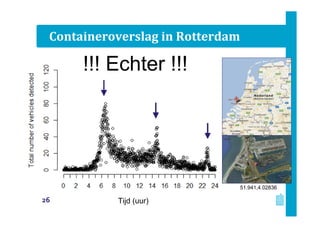
- 26. Containeroverslag in Rotterdam 51.941,4.02836 !!! Echter !!! Tijd (uur)26
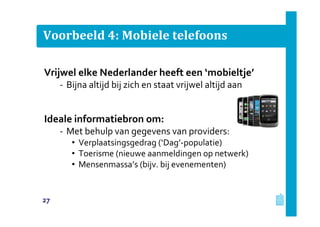
- 27. Voorbeeld 4: Mobiele telefoons Vrijwel elke Nederlander heeft een ŌĆśmobieltjeŌĆÖ ŌĆÉ Bijna altijd bij zich en staat vrijwel altijd aan Ideale informatiebron om: ŌĆÉ Met behulp van gegevens van providers: ŌĆó Verplaatsingsgedrag (ŌĆśDagŌĆÖ-populatie) ŌĆó Toerisme (nieuwe aanmeldingen op netwerk) ŌĆó MensenmassaŌĆÖs (bijv. bij evenementen) 27
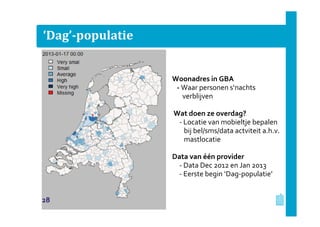
- 28. ŌĆśDagŌĆÖ-populatie Woonadres in GBA - Waar personen sŌĆśnachts verblijven Wat doen ze overdag? - Locatie van mobieltje bepalen bij bel/sms/data actviteit a.h.v. mastlocatie Data van ├®├®n provider - Data Dec 2012 en Jan 2013 - Eerste begin ŌĆśDag-populatieŌĆÖ 28
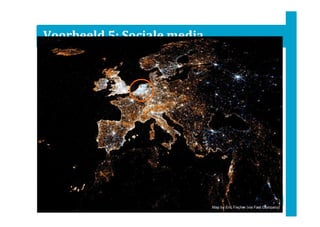
- 29. Voorbeeld 5: Sociale media ŌĆō Nederlanders zijn erg actief op sociale media ŌĆÉ Bijna altijd bij zich en staat vrijwel altijd aan ŌĆó Steeds meer mensen hebben een smartphone! ŌĆō Mogelijke informatiebron voor: ŌĆÉ Welke onderwerpen zijn actueel: ŌĆó Aantal berichten en sentiment hierover ŌĆÉ Als meetinstrument te gebruiken voor: ŌĆó . Map by Eric Fischer (via Fast Company)
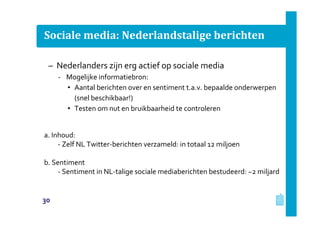
- 30. Sociale media: Nederlandstalige berichten ŌĆō Nederlanders zijn erg actief op sociale media ŌĆÉ Mogelijke informatiebron: ŌĆó Aantal berichten over en sentiment t.a.v. bepaalde onderwerpen (snel beschikbaar!) ŌĆó Testen om nut en bruikbaarheid te controleren a. Inhoud: - Zelf NL Twitter-berichten verzameld: in totaal 12 miljoen b. Sentiment - Sentiment in NL-talige sociale mediaberichten bestudeerd: ~2 miljard 30
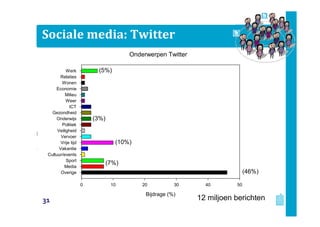
- 31. Sociale media: Twitter Onderwerpen Twitter Bijdrage (%) 0 10 20 30 40 50 Thema's Overige Media Sport Cultuur/events Vakantie Vrije tijd Vervoer Veiligheid Politiek Onderwijs Gezondheid ICT Weer Milieu Economie Wonen Relaties Werk (46%) (10%) (7%) (3%) (5%) 12 miljoen berichten31
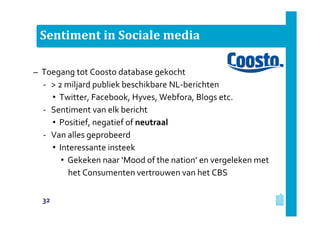
- 32. Sentiment in Sociale media ŌĆō Toegang tot Coosto database gekocht ŌĆÉ > 2 miljard publiek beschikbare NL-berichten ŌĆó Twitter, Facebook, Hyves, Webfora, Blogs etc. ŌĆÉ Sentiment van elk bericht ŌĆó Positief, negatief of neutraal ŌĆÉ Van alles geprobeerd ŌĆó Interessante insteek ŌĆó Gekeken naar ŌĆśMood of the nationŌĆÖ en vergeleken met het Consumenten vertrouwen van het CBS 32
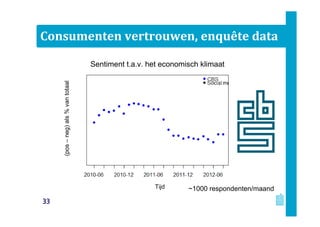
- 33. Consumenten vertrouwen, enqu├¬te data Sentiment t.a.v. het economisch klimaat ~1000 respondenten/maand (posŌĆōneg)as%oftotal(posŌĆōneg)als%vantotaal Tijd 33
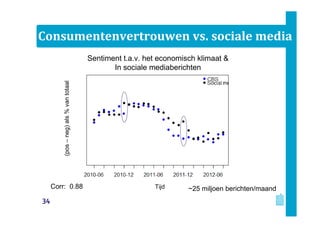
- 34. Consumentenvertrouwen vs. sociale media Corr: 0.88 ~25 miljoen berichten/maand Sentiment t.a.v. het economisch klimaat & In sociale mediaberichten(posŌĆōneg)als%vantotaal Tijd 34
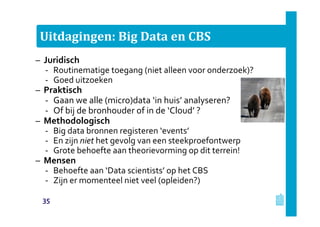
- 35. Uitdagingen: Big Data en CBS ŌĆō Juridisch ŌĆÉ Routinematige toegang (niet alleen voor onderzoek)? ŌĆÉ Goed uitzoeken ŌĆō Praktisch ŌĆÉ Gaan we alle (micro)data ŌĆśin huisŌĆÖ analyseren? ŌĆÉ Of bij de bronhouder of in de ŌĆśCloudŌĆÖ ? ŌĆō Methodologisch ŌĆÉ Big data bronnen registeren ŌĆśeventsŌĆÖ ŌĆÉ En zijn niet het gevolg van een steekproefontwerp ŌĆÉ Grote behoefte aan theorievorming op dit terrein! ŌĆō Mensen ŌĆÉ Behoefte aan ŌĆśData scientistsŌĆÖ op het CBS ŌĆÉ Zijn er momenteel niet veel (opleiden?) 35
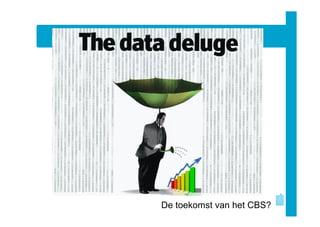
- 36. De toekomst van het CBS?