Valuing securities in complex capital structures - Baker Tilly presentation
- 1. Baker Tilly refers to Baker Tilly Virchow Krause, LLP, an independently owned and managed member of Baker Tilly International. © 2010 Baker Tilly Virchow Krause, LLP Valuing Securities in Complex Capital Structures January 13, 2016 Presented by: Paul Daddio, CFA, ASA Senior Manager 703-923-8562 paul.daddio@bakertilly.com
- 2. Presentation Outline • The “Cheap Stock Guide” • Estimating enterprise value • Allocating enterprise value • Backsolve Method • Debt 2 Presentation Outline
- 3. “Valuation of Privately Held Company Equity Securities Issued as Compensation” (the “Cheap Stock Guide”) • Developed by AICPA staff and the Equity Securities Task Force. • Originally issued in 2004 with an updated version released in 2013. • Developed relative to ASC 718, Compensation—Stock Compensation. However, applicable for a wide variety of contexts 3 The “Cheap Stock Guide”
- 4. Estimating Enterprise Value 1. Income Approach • Discounted Cash Flow Method (“DCF Method”) • Capitalization of Cash Flow Method 2. Market Approach • Merged and Acquired Company Method (“M&A Method”) • Guideline Publicly Traded Company Method (“GPTC Method”) 3. Asset Approach 4 Estimating Enterprise Value
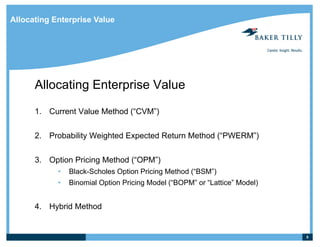
- 5. Allocating Enterprise Value 1. Current Value Method (“CVM”) 2. Probability Weighted Expected Return Method (“PWERM”) 3. Option Pricing Method (“OPM”) • Black-Scholes Option Pricing Method (“BSM”) • Binomial Option Pricing Model (“BOPM” or “Lattice” Model) 4. Hybrid Method 5 Allocating Enterprise Value
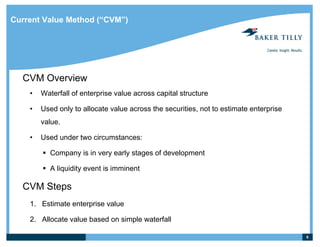
- 6. Current Value Method (“CVM”) CVM Overview • Waterfall of enterprise value across capital structure • Used only to allocate value across the securities, not to estimate enterprise value. • Used under two circumstances:  Company is in very early stages of development  A liquidity event is imminent CVM Steps 1. Estimate enterprise value 2. Allocate value based on simple waterfall 6
- 7. Complex Capital Structures: Payoff Diagram Example Company: XYZ, Inc. > Equity securities: (a) 60,000 shares of common stock and (b) 40,000 shares of convertible preferred stock having total liquidation preference of $7.5 million (non-participating, convertible to common shares at a 1:1 ratio). > Projected sale of the company: 3 years after valuation date. 7
- 8. Probability Weighted Expected Return Method (“PWERM”) PWERM Overview • Similar to CVM in that it uses waterfall approach, but applies across multiple scenarios • Can be used to estimate enterprise value and allocate value across securities • Appropriate when management can reasonably predict potential exit outcomes and exit is expected to occur in the relatively near term • Generally not considered appropriate for valuing options, profits interests, or warrants • Not considered appropriate for early stage companies 8
- 9. PWERM Steps: 1. Select exit scenarios 2. Estimate future enterprise values for each scenario 3. Waterfall future enterprise values 4. Discount future cash flow to subject investments to present value 5. Assign probabilities to each scenario value 6. Estimate share value by summing the probability-weighted outcome of each scenario 9 Probability Weighted Expected Return Method (“PWERM”)
- 10. PWERM (cont.) Payoff Diagram Example Company: XYZ, Inc. > Equity securities: (a) 60,000 shares of common stock and (b) 40,000 shares of convertible preferred stock having total liquidation preference of $7.5 million (non-participating, convertible to common shares at a 1:1 ratio). > Projected sale of the company: 3 years after valuation date. 10
- 11. PWERM (cont.) PWERM Example: XYZ, Inc. 11 XYZ, Inc. PWERM Analysis $ in 000s, except per share amounts Scenario ($ in 000s) I. M&A Sale High II. M&A Sale Low III. Dissolution Probability of Liquidity Event 45% 45% 10% Time to Liquidity (year) 3.0 3.0 3.0 Enterprise Value at Liquidity Event 25,000$ 10,000$ 3,000$ less : Net Debt at Liquidity Event - - - Equity Value 25,000$ 10,000$ 3,000$ Distribution per Share (Future Value) I. M&A Sale High II. M&A Sale Low III. Dissolution Series A Convertible Preferred Stock 250.00$ 187.50$ 75.00$ Common Stock 250.00$ 41.67 - Discount rate 40% 40% 40% Present Value Factor 0.364 0.364 0.364 Fair Value per Share Distributions per Share (Present Value) (probability-weighted) Series A Convertible Preferred Stock 91.11$ 68.33$ 27.33$ 74.48$ Common Stock 91.11$ 15.18$ -$ 47.83$
- 12. The Option Pricing Method (“OPM”) OPM Overview • Two methods: • Black-Scholes Option Pricing Method (BSM) • Binomial Option Pricing Method (BOPM or “Lattice” Method) • OPM is used to allocate value, not estimate enterprise value (unless can backsolve) • BSM is generally more commonly applied than BOPM • OPM is most appropriate when little visibility to exit • Think of an BSM as a PWERM with infinite exit scenarios and BOPM as PWERM with a ton of exit scenarios 12
- 13. OPM (cont.) BSM Steps: 1. Estimate enterprise or equity value (using income / market / asset approach) 2. Determine strike price for each option tranche 3. Estimate projected exit date (sale of company, IPO) 4. Determine other key inputs for the Black-Scholes formulas • Volatility • Risk-free discount rate • Dividend yield 5. Calculate value for each tranche using Black-Scholes 6. Allocate value of each tranche across the capital structure of the company 13
- 14. OPM (cont.) Payoff Diagram Example Company: XYZ, Inc. > Equity securities: (a) 60,000 shares of common stock and (b) 40,000 shares of convertible preferred stock having total liquidation preference of $7.5 million (non-participating, convertible to common shares at a 1:1 ratio). > Projected sale of the company: 3 years after valuation date. 14
- 15. OPM (cont.) 15 OPM Example: XYZ, Inc. (figure 1 of 2) XYZ, Inc. OPM: Indication of Option Values $ in 000s Equity value is $0 Tranche 1 preferred stock receives liquidation preference preferred stock converts to common stock Tranche 3 Value of Equity [a] 5,000$ 5,000$ 5,000$ Exercise Price [b] -$ 7,500$ 18,750$ Years until exit [c] 3.0 3.0 3.0 Volatility [d] 60% 60% 60% Dividend Rate [e] 0% 0% 0% Discount Rate [f] 0.88% 0.88% 0.88% Call option value 5,000$ 1,536$ 544$ Incremental value of options 3,464$ 992$ 544$ Footnote: [f] Discount rate is based on treasury yield as of the Valuation Date with maturity equal to term. [a] Total equity value of the Company. [b] Exercise price is derived based on enterprise value at which the given security would reach their liquidation preference or at which a holder of the security would opt to convert. [c] Expriation is based on Company management's assumption of exit scenario timeline, market analysis, and [d] Volatility is the estimated annual standard deviation of the Company's equity value, as estimated based on the annual standard deviations observed for the guideline publicly traded companies selected. [e] Based on management's projections.
- 16. OPM (cont.) 16 OPM Example: XYZ, Inc. (figure 2 of 2) XYZ, Inc. OPM: Indication of Option Values $ in 000s Tranche 1 - 2 Tranche 2 - 3 Tranche 3 - 4 Total Fair Value Per Share Liquidation Preference ($000s) / Shares Liquidation Preference Shares Shares Series A Convertible Preferred Stock 7,500$ 0 40,000 Common Stock 0 60,000 60,000 Total 7,500$ 60,000 100,000 % of Liquidation Preference / Shares Series A Convertible Preferred Stock 100.0% 0.0% 40.0% Common Stock 0.0% 100.0% 60.0% Total 100.0% 100.0% 100.0% Allocation of Value ($000s, except per share) Series A Convertible Preferred Stock 3,464$ -$ 218$ 3,682$ $92.05 Common Stock - 992 326 1,318 $21.97 Total 3,464$ 992$ 544$ 5,000$
- 17. Binomial Option Pricing Model (BOPM or “Lattice” Model) Lattice Model • Essentially the same conceptually as BSM (same inputs as well) • Models future value as progression of value nodes from valuation date to exit. Value equals probability weighted PV of exit values. • Strength: good for modeling discrete events (real options, financing rounds, etc.) • Weakness: assumptions regarding the terms and conditions of future financing rounds are difficult to estimate 17
- 18. Binomial Option Pricing Model (BOPM or “Lattice” Model) 18 Lattice Model $ in 000s 0 1 2 3 4 5 6 7 8 9 10 11 12 Value of current equity 166$ 325$ 618$ 1,127$ 1,928$ 3,556$ 5,108$ 7,215$ 10,062$ 13,909$ 19,105$ 26,123$ 35,598$ 43 98 225 513 1,577 2,391 3,530 5,089 7,196 10,043 13,890 19,086 0 0 0 585 961 1,532 2,359 3,511 5,069 7,176 10,023 0 0 163 297 526 903 1,489 2,340 3,492 5,050 0 29 60 121 237 455 842 1,470 2,320 3 6 13 30 69 157 360 822 0 0 0 0 0 0 0 0 0 0 0 0 0 0 0 0 0 0 0 0 0 0 0 0 0 0 0 0 Period
- 19. PWERM Strengths and Weaknesses PWERM • Strengths: > Good for estimating value when reasonably good visibility to an exit > More directly models investment exit outlook than OPM > Aligns with the boom or bust dichotomy of certain types of companies • Weaknesses: > Highly subjective inputs > Not a lot of standardized guidance > Prone to management bias – needs to be validated with empirical market evidence > Requires handicapping future events requiring estimation / guessing 19
- 20. OPM • Strengths: > Good for estimating value when outcomes are difficult to estimate > Inputs can be audited > Better than PWERM at valuing options > Fair amount of standardized guidance • Weaknesses: > Doesn’t model skewed distributions well > Less intuitive for the layperson / client than PWERM 20 OPM Strengths and Weaknesses
- 21. Hybrid Method The Hybrid Method • The Hybrid Method utilizes the PWERM, using the OPM to allocate value within one or more scenarios • Useful when company has transparency into one or more near term exits, but unsure about what will occur if those don’t obtain. 21
- 22. Backsolve Method Backsolve Method • Uses transaction in a security to value the other securities issued by the company • Can be applied under OPM or PWERM • Value of the enterprise is imputed from security transaction price • Caveats; may not be appropriate if • Non-arm’s length • Strategic investment • Backsolve Method should be supported by other methodologies 22
- 23. Debt Debt: • Valuing debt is critical to valuing equity • Yield Method • Value of debt = present value of all cash flows discounted at a market yield. • Market yield estimated using synthetic rating analysis • Yield on the debt when originally issued is used as baseline (if arm’s length). • Yield at original issuance date = risk-free rate + credit spread + subordination premium / company-specific risk premium • OPM • Applicable for companies with extreme leverage 23


![OPM (cont.)
15
OPM Example: XYZ, Inc. (figure 1 of 2)
XYZ, Inc.
OPM: Indication of Option Values
$ in 000s
Equity value is $0
Tranche 1
preferred stock
receives
liquidation
preference
preferred stock
converts
to common stock
Tranche 3
Value of Equity [a] 5,000$ 5,000$ 5,000$
Exercise Price [b] -$ 7,500$ 18,750$
Years until exit [c] 3.0 3.0 3.0
Volatility [d] 60% 60% 60%
Dividend Rate [e] 0% 0% 0%
Discount Rate [f] 0.88% 0.88% 0.88%
Call option value 5,000$ 1,536$ 544$
Incremental value of options 3,464$ 992$ 544$
Footnote:
[f] Discount rate is based on treasury yield as of the Valuation Date with maturity equal to term.
[a] Total equity value of the Company.
[b] Exercise price is derived based on enterprise value at which the given security would reach their liquidation
preference or at which a holder of the security would opt to convert.
[c] Expriation is based on Company management's assumption of exit scenario timeline, market analysis, and
[d] Volatility is the estimated annual standard deviation of the Company's equity value, as estimated based on the
annual standard deviations observed for the guideline publicly traded companies selected.
[e] Based on management's projections.](https://image.slidesharecdn.com/018a1737-3bb5-4544-8583-b552f7ea8b9a-160118194959/85/Valuing-securities-in-complex-capital-structures-Baker-Tilly-presentation-15-320.jpg)


