Cnu Elgin Study February 2010
- 1. Slaying the Sprawl Dragon
- 2. Source: Noah Radford Norman W. Garrick
- 3. Davis, CA 14 % of people ride to work
- 4. Davis, CA Road Fatality Rate: 1 per 100,000
- 5. Road Fatality Rate for All 157 California Cities Over 40,000 number per 100,000 population 0.0 17.3
- 6. Road Fatality Rate for All 157 California Cities Over 40,000 number per 100,000 population
- 7. Ěý
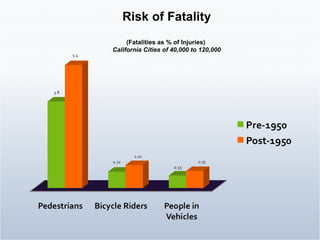
- 8. Risk of Fatality (Fatalities as % of Injuries) California Cities of 40,000 to 120,000
- 9. Ěý
- 10. Adapted from Stephen Marshall Pre-1950’s Post-1950’s Evolution of the Street Network
- 11. Ěý
- 12. Ěý
- 13. Ěý
- 14. FHA Technical Bulletin No. 7 (1938) Planning Profitable Neighborhoods
- 15. According to the FHA the grid layout was Monotonous Had Little Character Uneconomical Posed Safety Concerns
- 16. Street network, safety and sustainability in 24 medium sized California cities Cities selected to represent a range of traffic safety level
- 17. Ěý
- 18. Shape and Configuration Network Scale Network Connectivity
- 19. Citywide Street Network Neighborhood Street Network Linear Tree Grid Tributary Radial Grid Tree Adapted from Stephen Marshall, Streets & Patterns
- 20. 550 Intersections per Square Mile Network Scale
- 21. Network Scale 250 Intersections per Square Mile
- 22. 110 Intersections per Square Mile Network Scale
- 23. 45 Intersections per Square Mile Network Scale
- 24. Link-to-Node Ratio = 1.61 Link-to-Node Ratio = 1.13 Link-to-Node Ratio = 1.16 Network Connectivity
- 25. Street Network Properties Street Design Properties Average Total Number of Lanes Average Outside Shoulder Width Raised Median Painted Median On-Street Parking Bike Lanes Raised Curbs Travel and Activity Level Distance from City Center Income Mix of Land Use Variables included in Our Safety and Travel Choice Models
- 26. Safety Analysis Based on Geo-coding 230,000 Accident Records in 24 California Cities
- 27. Safety and Travel Choice Analysis done for 1040 Census Block Groups 24 California Cities
- 28. Travel Choice Based on Census Data 1040 Census Block Groups, 24 California Cities
- 29. versus
- 30. versus Safety Risk of Severe Injury or Fatality Chance of being Severely Injured 30% Higher Chance of being Killed 50% Higher
- 31. Odds of Dying in a Road Accident based on Intersection Density 1 in 200 1 in 500
- 32. Percentage of People Walking, Biking or Taking Transit
- 33. Percentage of People Walking, Biking or Taking Transit Effect of Intersection Density for Cul-de-sac Network
- 34. Percentage of People Walking, Biking or Taking Transit Effect of Intersection Density for Gridded Network
- 35. Ěý
- 36. Ěý
- 37. Ěý
- 38. Ěý
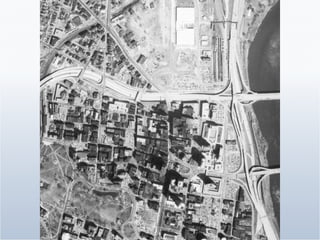
- 39. Downtown Hartford 1960 to 2000 Parking
- 40. City of Hartford 1960 to 2000 Population and Employment
- 42. Norman W. Garrick 11 X 2 X
- 43. Ěý
- 44. Norman W. Garrick Sustainability Gap USA Norway Daily Miles Traveled For every man, woman and child
- 45. Ěý
- 46. Ěý
- 47. Why Reduce Car Use? More life More attractive downtown Give downtown a competitive edge
- 49. Denver, Colorado Norman W. Garrick 16 th Street Mall
- 56. Norman W. Garrick Community or Project?
- 57. Norman W. Garrick Will form follow function
- 58. Norman W. Garrick Integration of key
Editor's Notes
- To tame the street so all street users can share in its function for their specific needs, We have to reduce the vehicle operating speeds.


