際際滷

際際滷Share a Scribd company logo
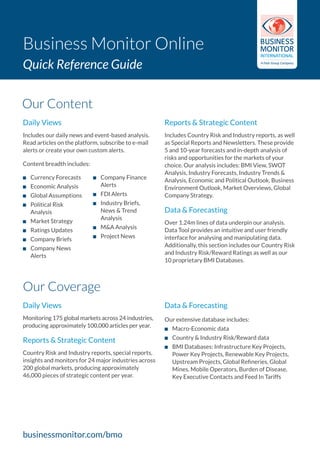
Daily Views
Includes our daily news and event-based analysis.
Read articles on the platform, subscribe to e-mail
alerts or create your own custom alerts.
Content breadth includes:
Reports & Strategic Content
Includes Country Risk and Industry reports, as well
as Special Reports and Newsletters. These provide
5 and 10-year forecasts and in-depth analysis of
risks and opportunities for the markets of your
choice. Our analysis includes: BMI View, SWOT
Analysis, Industry Forecasts, Industry Trends &
Analysis, Economic and Political Outlook, Business
Environment Outlook, Market Overviews, Global
Company Strategy.
Data & Forecasting
Over 1.24m lines of data underpin our analysis.
Data Tool provides an intuitive and user friendly
interface for analysing and manipulating data.
Additionally, this section includes our Country Risk
and Industry Risk/Reward Ratings as well as our
10 proprietary BMI Databases.
Daily Views
Monitoring 175 global markets across 24 industries,
producing approximately 100,000 articles per year.
Reports & Strategic Content
Country Risk and Industry reports, special reports,
insights and monitors for 24 major industries across
200 global markets, producing approximately
46,000 pieces of strategic content per year.
Data & Forecasting
Our extensive database includes:
QQ Macro-Economic data
QQ Country & Industry Risk/Reward data
QQ BMI Databases: Infrastructure Key Projects,
Power Key Projects, Renewable Key Projects,
Upstream Projects, Global Refineries, Global
Mines, Mobile Operators, Burden of Disease,
Key Executive Contacts and Feed In Tariffs
QQ Currency Forecasts
QQ Economic Analysis
QQ Global Assumptions
QQ Political Risk
Analysis
QQ Market Strategy
QQ Ratings Updates
QQ Company Briefs
QQ Company News
Alerts
QQ Company Finance
Alerts
QQ FDI Alerts
QQ Industry Briefs,
News & Trend
Analysis
QQ M&A Analysis
QQ Project News
Our Coverage
Our Content
Business Monitor Online
Quick Reference Guide
businessmonitor.com/bmo
To get started, select your main interest: select either a Geography or a Service.
Select your content type from Daily Views, Reports & Strategic Content or Data & Forecasting.
You can drill down further into content types by using the sub tabs (e.g. Analysis, Strategic Content).
Select your filters. You can select multiple filters, which can be cleared at any time.
Quickly download the report/article to PDF. Hovering over the article/report allows you to save,
print, email the analyst and preview the article/report.
You can save your main navigation and filter selections  your five latest saved views can be directly
accessed using the arrow key, and are also available within the saved content section of My BMO.
Related Content Area: content relevant to your selection can be found here.
How The Service Works
1
2
3
4
5
6
7
2
6 7
6
4
3
5
1
Inside an Article/Report:
Icons
Email the analyst, save the article/report, download article to PDF, download the full report (strategic
content only) and print the article/report.
Related Analysis/News
Content relevant to your selection can be found here.
Explore Data
Where possible, the data used to create the charts and tables contained within our articles and reports can
be explored in Data Tool and downloaded to Excel.
businessmonitor.com/bmo
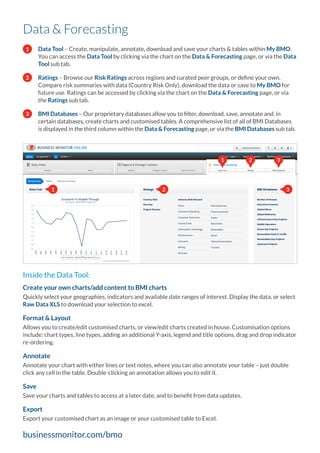
Data Tool  Create, manipulate, annotate, download and save your charts & tables within My BMO.
You can access the Data Tool by clicking via the chart on the Data & Forecasting page, or via the Data
Tool sub tab.
Ratings  Browse our Risk Ratings across regions and curated peer groups, or define your own.
Compare risk summaries with data (Country Risk Only), download the data or save to My BMO for
future use. Ratings can be accessed by clicking via the chart on the Data & Forecasting page, or via
the Ratings sub tab.
BMI Databases  Our proprietary databases allow you to filter, download, save, annotate and, in
certain databases, create charts and customised tables. A comprehensive list of all of BMI Databases
is displayed in the third column within the Data & Forecasting page, or via the BMI Databases sub tab.
Data & Forecasting
1
2
3
1
1 2 3
2 3
Inside the Data Tool:
Create your own charts/add content to BMI charts
Quickly select your geographies, indicators and available date ranges of interest. Display the data, or select
Raw Data XLS to download your selection to excel.
Format & Layout
Allows you to create/edit customised charts, or view/edit charts created in house. Customisation options
include: chart types, line types, adding an additional Y-axis, legend and title options, drag and drop indicator
re-ordering.
Annotate
Annotate your chart with either lines or text notes, where you can also annotate your table  just double
click any cell in the table. Double-clicking an annotation allows you to edit it.
Save
Save your charts and tables to access at a later date, and to benefit from data updates.
Export
Export your customised chart as an image or your customised table to Excel.
businessmonitor.com/bmo

More Related Content

Quick reference guide bmo

  • 1. Daily Views Includes our daily news and event-based analysis. Read articles on the platform, subscribe to e-mail alerts or create your own custom alerts. Content breadth includes: Reports & Strategic Content Includes Country Risk and Industry reports, as well as Special Reports and Newsletters. These provide 5 and 10-year forecasts and in-depth analysis of risks and opportunities for the markets of your choice. Our analysis includes: BMI View, SWOT Analysis, Industry Forecasts, Industry Trends & Analysis, Economic and Political Outlook, Business Environment Outlook, Market Overviews, Global Company Strategy. Data & Forecasting Over 1.24m lines of data underpin our analysis. Data Tool provides an intuitive and user friendly interface for analysing and manipulating data. Additionally, this section includes our Country Risk and Industry Risk/Reward Ratings as well as our 10 proprietary BMI Databases. Daily Views Monitoring 175 global markets across 24 industries, producing approximately 100,000 articles per year. Reports & Strategic Content Country Risk and Industry reports, special reports, insights and monitors for 24 major industries across 200 global markets, producing approximately 46,000 pieces of strategic content per year. Data & Forecasting Our extensive database includes: QQ Macro-Economic data QQ Country & Industry Risk/Reward data QQ BMI Databases: Infrastructure Key Projects, Power Key Projects, Renewable Key Projects, Upstream Projects, Global Refineries, Global Mines, Mobile Operators, Burden of Disease, Key Executive Contacts and Feed In Tariffs QQ Currency Forecasts QQ Economic Analysis QQ Global Assumptions QQ Political Risk Analysis QQ Market Strategy QQ Ratings Updates QQ Company Briefs QQ Company News Alerts QQ Company Finance Alerts QQ FDI Alerts QQ Industry Briefs, News & Trend Analysis QQ M&A Analysis QQ Project News Our Coverage Our Content Business Monitor Online Quick Reference Guide businessmonitor.com/bmo
  • 2. To get started, select your main interest: select either a Geography or a Service. Select your content type from Daily Views, Reports & Strategic Content or Data & Forecasting. You can drill down further into content types by using the sub tabs (e.g. Analysis, Strategic Content). Select your filters. You can select multiple filters, which can be cleared at any time. Quickly download the report/article to PDF. Hovering over the article/report allows you to save, print, email the analyst and preview the article/report. You can save your main navigation and filter selections your five latest saved views can be directly accessed using the arrow key, and are also available within the saved content section of My BMO. Related Content Area: content relevant to your selection can be found here. How The Service Works 1 2 3 4 5 6 7 2 6 7 6 4 3 5 1 Inside an Article/Report: Icons Email the analyst, save the article/report, download article to PDF, download the full report (strategic content only) and print the article/report. Related Analysis/News Content relevant to your selection can be found here. Explore Data Where possible, the data used to create the charts and tables contained within our articles and reports can be explored in Data Tool and downloaded to Excel. businessmonitor.com/bmo
  • 3. Data Tool Create, manipulate, annotate, download and save your charts & tables within My BMO. You can access the Data Tool by clicking via the chart on the Data & Forecasting page, or via the Data Tool sub tab. Ratings Browse our Risk Ratings across regions and curated peer groups, or define your own. Compare risk summaries with data (Country Risk Only), download the data or save to My BMO for future use. Ratings can be accessed by clicking via the chart on the Data & Forecasting page, or via the Ratings sub tab. BMI Databases Our proprietary databases allow you to filter, download, save, annotate and, in certain databases, create charts and customised tables. A comprehensive list of all of BMI Databases is displayed in the third column within the Data & Forecasting page, or via the BMI Databases sub tab. Data & Forecasting 1 2 3 1 1 2 3 2 3 Inside the Data Tool: Create your own charts/add content to BMI charts Quickly select your geographies, indicators and available date ranges of interest. Display the data, or select Raw Data XLS to download your selection to excel. Format & Layout Allows you to create/edit customised charts, or view/edit charts created in house. Customisation options include: chart types, line types, adding an additional Y-axis, legend and title options, drag and drop indicator re-ordering. Annotate Annotate your chart with either lines or text notes, where you can also annotate your table just double click any cell in the table. Double-clicking an annotation allows you to edit it. Save Save your charts and tables to access at a later date, and to benefit from data updates. Export Export your customised chart as an image or your customised table to Excel. businessmonitor.com/bmo