Econ diagrams
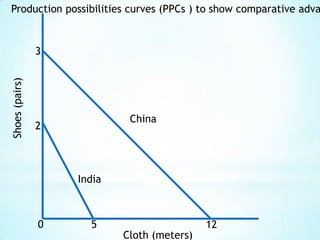
- 1. Production possibilities curves (PPCs ) to show comparative advantage3Shoes (pairs)China2India0512Cloth (meters)
- 2. Comparative Advantage China has an absolute advantage in the production of both shoes and cloth. It can produce more of both than India with the same factor inputs. However, India has a comparative advantage in producing shoes, since they only give up 2.5 meters of cloth for each pair, whereas China gives up 4 meters of cloth. China should specialize in cloth and India should specialize in shoes.
- 3. Free Trade in CornDSdomesticPrice of corn ($ per tonne)SworldQ1QeQ3Quantity of Corn (tonnes)
- 4. Free TradeBefore trade, Qe corn is produced domestically at a price of Pe. When free trade takes place, Q1Q2 of corn is imported at the world price of Pw, and Q1 of corn is produced domestically.
- 5. A subsidy on domestic wheat productionSdomesticDSdomestic + subsidyPrice of corn ($ per tonne)SworldQ1Q3Q2Quantity of Corn (tonnes)
- 6. SubsidyWhen the government gives a subsidy to domestic producers, the domestic supply curve shifts downwards from Sdomestic to Sdomestic + subsidy. The price to consumers remains the same, but imports fall from Q1Q2 and domestic production increases from Q1 to Q3.
- 7. A tariff on corn importsSdomesticDPrice of corn ($ per tonne)Sworld+ tariff SworldQ1Q3Q4Q2Quantity of Corn (tonnes)
- 8. TariffThe imposition of a tariff upon imported corn means that the price will rise from Pw to Pw + tariff. Imports will fall from Q1Q2 to Q3Q4 and domestic production will increase from Q1 to Q3.
- 9. J-CurveZCurrent account surplus0TimeXCurrent account deficitY
- 10. J-CurveThe country has a current account deficit and is at X on the diagram. The exchange rate of the currency is lowered to rectify this. In the short term, because of existing contracts and imperfect knowledge, the deficit worsens to Y. However, in the long term, if the Marshall-Lerner condition is fulfilled, export revenue will begin to increase and import expenditure will start to fall. The current account deficit will get smaller, moving in the direction of Z on the diagram.
- 11. A floating currencyS (of PoundfromUK)1 Pound =1.26Price of Pound in EuroD (for Pound from EU)Q0Quantity of Pound
- 12. Floating CurrencyThe exchange rate of the pound against the Euro is being determined solely by the demand for the pound and the supply of it. In this case, the exchange rate will be 1 pound = 1.26 euros.
- 13. An increase in the demand for the PoundS 1.37Price of Pound in Euro1.26D2D1Q0Quantity of Pound
- 14. An increase in the demand for the PoundThe demand for the pound has increased from D1 to D2. this may have been caused by an increase in UK interest rates, increased demand for UK products, speculation that the pound will increase in value, or a more favorable investment climate in the UK. In all cases, EU citizens will want more pounds, thus increasing the demand for the pound on the foreign exchange market. The exchange rate of the pound will rise to 1 pound = 1.37 euros.
- 15. An increase in the supply of the PoundS1S2Price of Pound in Euro1.261.15D0Quantity of Pound
- 16. Increase in supplyThe supply of the pound has increased from S1 to S2. this may have been caused by an increase in foreign interest rates, increased demand for foreign products, speculation that the pounds will decrease in value, or amore favorable investment climate in foreign countries. In all cases, UK citizens will want more foreign currency, thus increasing the supply of pounds on the foreign exchange market. The exchange rate of the pound will fall to 1 pound = 1.15 euros.


