


![Team #30254 Page 5 of 15
4.2.3 Basic Analyses
Related data are available at the URL: http://www.oakland.edu/grossmanrerdoshp.html.
These data can be represented as a graph called the Erdo?s collaboration graph ˇŞ ¦Ĺ = (V, E) .
The set of its vertices V consists of known authors with nE ˇÜ 2 , and its edges connect two authors,
if they wrote a joint paper, and at least one of them has nE ˇĘ {0, 1} ˇŞ the data about collaboration
among authors with nE = 2 are not available.
Based on 510 Erdos1 authors network, some basic statistics about the number of co-authors can
be concluded as Table 2. In the Erdos1 co-author network, the smallest degree is 1 compared to the
biggest one 97. The maximizer is Abbott, Harvey Leslie. Besides, the average degree is 12.2549,
which indicates a relatively high cooperating level.
Table 2: Basic statistics on degrees in Erdos collaboration graph
nE = 1
Minimum 1
Median 7
Average degree 12.2549
Maximum 97
Maximizer Abbott, Harvey Leslie
5 Core
5.1 De?nition
The notion of a core was introduced by Seidman in 1983 [3].Let G = (V, L) be a graph. V is
the set of vertices and L is the set of lines (edges or arcs). We will denote n = |V | and m = |L|.
A subgraph Hk = (W, L|W) induced by the set W is a k-core or a core of order k iff ?v ˇĘ W:
deg H(v) ˇÝ k, and Hk is the maximum subgraph with this property. The core of maximum order is
also called the main core. The core number of vertex v is the highest order of a core that contains this
vertex.](https://image.slidesharecdn.com/d1f5e7b2-2645-411a-9e7f-289f19c844b5-160102195948/85/-7-320.jpg)


![Team #30254 Page 15 of 15
References
[1] Vladimir Batagelj*, Andrej Mrvar, Some analyses of ErdoˇŻs collaboration graph, Social Networks
22 2000. 173¨C186.
[2] Batagelj, V., Mrvar, A., 1998. Pajek ˇŞ a program for large network analysis. Connections 21 2 ,
47¨C57.
[3] M. E. J. Newman, The structure and function of complex networks, SIAM Rev.,45(2), 167¨C256.
(90 pages).
[4] Vladimir Batagelj, Matjaz Zaversnik, An O(m) Algorithm for Cores Decomposition of Networks
, 2003.
[5] Batagelj, V. and Mrvar, A. (1998) Pajek -A Program for Large Network Analysis,Connections,
21 (2), 47-57.
[6] Paul Edelman & Tracey George, Six Degrees of Cass Sunstein: Collaboration Networks in Legal
Scholarship, Green Bag 2d, Vol. 11, No. 1, p. 19, 2007
[7] Batagelj, V. and Mrvar, A. (2000) Some Analyses of ErdoˇŻs Collaboration Graph,Social Net-
works, 22, 173-186](https://image.slidesharecdn.com/d1f5e7b2-2645-411a-9e7f-289f19c844b5-160102195948/85/-17-320.jpg)


More Related Content
Similar to ĂŔČüÂŰÎÄ (20)
ĂŔČüÂŰÎÄ
- 1. for of?ce use only T1 T2 T3 T4 Team Control Number 30254 Problem Chosen C for of?ce use only T1 T2 T3 T4 Measuring the in?uence in the network Summary This paper aims to build a internet based network model to measure the impact of in?uence. Validity and science have been veri?ed through several examples. Firstly, a network of Erdos1 is built through the small world model. The model aims at digging out the relationship among the Erdos1 co-author. To quantify the impact of the in?uence objectively, the concept of the core is introduced and we divide the co-authors of the Erdos1 into different class. Generally speaking, the impact of the in?uence is near of the authors from different classes. We set the biggest number of core to be the main core (elite core). The authors among this main core are the ones that have relatively larger impact of in?uence. To study the different characteristic of the impact of the authors, the concept of average degree, average core and coll are introduced. These concepts are introduced to determine the range of in?uence. We ?nd that some authors whom we call them the ˇ°transferorˇ± with relatively larger impact of in?uence are not only active in their own core ?eld but also are very interactive outside their core ?eld through analyzing the data processed by the model. De?nitely, this phenomenon enables the advanced theory of the main core can be delivered to the other research ?elds, and meanwhile it can absorb the advanced theories from the other research ?elds. This interactive process boosts the prosperity of the whole academic ?eld. On the other hand, some authors whom we call them the ˇ°insiderˇ± with large impact of in?uence only collaborate within their own core, whatˇŻ more, a number of these insiders are the leaders in the researching ?eld. One main feature of them is that they all are abled man, so the way they cooperate makes it more likely to contribute creativities to their ?eld. Secondly, this system of measurement can also be applied to measuring the quality and the im- portance of the papers. Another type of in?uence measure might be to compare the signi?cance of a research paper by analyzing the important works that follow from its publication. We determine the times that a paper is quoted by introducing the concept of degree, and then calculate the core number on the basis of the out degree. This is the standard of the impact of in?uence of the paper. Meanwhile, we analyze the impact towards the outside by studying the coll, average coll and average output degree. Thirdly, we design an example of movie actor through setting up a network of a personˇŻs relation- ship. We want to analyze the most in?uential person and also make a wise decision to decide whom to work with. This is to verify the validity and the science of this model. In the end, we make a conclusion of strength, weakness, sensitivity analysis and the power of the model. Still we canˇŻt overcome the original disadvantages of the model. There are still many factors that can in?uence the validity of the model. This is also the part that we think the model can be improved, and the correctness of the model still needs to be discussed. In this paper, some techniques for analysis of large networks are presented on the tables and the ?gures using the program Pajek Key words: Erdos;Small World Model; Core; Complex Network; Influence; Measurement
- 2. Contents 1 Introduction 1 1.1 Background . . . . . . . . . . . . . . . . . . . . . . . . . . . . . . . . . . . . . . . 1 1.2 Our Work . . . . . . . . . . . . . . . . . . . . . . . . . . . . . . . . . . . . . . . . 1 2 Assumption 1 3 Basic Models of Network Topology 2 3.1 Random Network . . . . . . . . . . . . . . . . . . . . . . . . . . . . . . . . . . . . 2 3.2 Small World Networks . . . . . . . . . . . . . . . . . . . . . . . . . . . . . . . . . 3 3.2.1 The Watts-Strogatz model . . . . . . . . . . . . . . . . . . . . . . . . . . . 3 4 Small World Model 4 4.1 Introduction of the Small World . . . . . . . . . . . . . . . . . . . . . . . . . . . . 4 4.2 Erdos collaboration graph . . . . . . . . . . . . . . . . . . . . . . . . . . . . . . . . 4 4.2.1 Erdo?s number . . . . . . . . . . . . . . . . . . . . . . . . . . . . . . . . . . 4 4.2.2 Network of Erdos1 . . . . . . . . . . . . . . . . . . . . . . . . . . . . . . . 4 4.2.3 Basic Analyses . . . . . . . . . . . . . . . . . . . . . . . . . . . . . . . . . 5 5 Core 5 5.1 De?nition . . . . . . . . . . . . . . . . . . . . . . . . . . . . . . . . . . . . . . . . 5 5.2 Case analysis . . . . . . . . . . . . . . . . . . . . . . . . . . . . . . . . . . . . . . 6 6 Citation 10 7 To be a more famous actor 12 7.1 Case background . . . . . . . . . . . . . . . . . . . . . . . . . . . . . . . . . . . . 12 7.2 Case analysis . . . . . . . . . . . . . . . . . . . . . . . . . . . . . . . . . . . . . . 13 8 Conclusion 13 8.1 Strength . . . . . . . . . . . . . . . . . . . . . . . . . . . . . . . . . . . . . . . . . 13 8.2 Weakness . . . . . . . . . . . . . . . . . . . . . . . . . . . . . . . . . . . . . . . . 14 8.3 Sensitivity Analysis . . . . . . . . . . . . . . . . . . . . . . . . . . . . . . . . . . . 14 8.4 Power of Modeling . . . . . . . . . . . . . . . . . . . . . . . . . . . . . . . . . . . 14
- 3. Team #30254 Page 1 of 15 1 Introduction 1.1 Background Many methods have been created to measure in?uence of academic research, but the standards of measuring the in?uence arenˇŻt objectively enough. One of the existing methods to determine the in?uence is to conduct a network of co-author and the properties of citations through computer databases of scienti?c papers from different researching ?elds. Many researchers have dedicated to seeking the mechanics of complex network, and models like Generalized Random Graphs, Small-World Networks, and Scale-Free Networks are created. The Erdos Number mentioned in the case is subordinated to the model of Small-World Networks. Paul Erdos himself was one of the most famous academic co-authors in the 20th-century who had over 500 co-authors and published over 1400 technical research papers. 1.2 Our Work The development of our model is inspired by several ideas with respect to both small world mod- eling process and core modeling process. Firstly, we search the background information about Erdos and the network measurement meth- ods, and know that Erdos network is related to a complex network called small world. So we decided to build a small world model illustrating intrinsic relationship among Erdos1 authors. At the begin- ning of analysis, we calculate some basic data like the degree distribution of the author and growth of the number of Erdos co-authors. We de?ne the vertices as the Erdos1 authors and edges as the co-authorship of the authors. Thus, the degree equals to number of co-authors, which shows the level of collaboration. Secondly, we need to measure the properties of the in?uence deeply because for example some excellent researchers in the academic ?eld do not write paper with others frequently, but once their paper is published, it will make a great effect on othersˇŻ research. So we introduce core model to evaluate some speci?c properties of the in?uence according to the analysis of their average of degree, average of core and coll. Meanwhile we de?ne some persons as transformers and insiders to de?ne the differences of their role in the network. Thirdly, we apply our model to the measuring process of in?uence of papers. However, there is a property that needs to be changed. Since we measure the in?uence of a paper by analyzing the important works that follow from its publication, the out-degree is important in this task and all data are built on it. Fourthly, we decide to build a network model in movie ?eld and collect 20 movie actors co- relationship information. On one hand, we need to ?nd the most in?uential actor in the network. On the other hand, we are required to give wise decisions on how to choose an in?uential actor who can help make success. So we also examine the utility and science of our model. In the end, we also discuss how our model works, the advantages and disadvantages of our model and the parts that need to be improved. 2 Assumption Weight measures the proportion that each co-author contributes to the paper. Suppose a researcher collaborates on the writing of a paper with n authors in total, i.e. s/he has n ? 1 coauthors on that paper. We therefore assume that s/he is acquainted with each coauthor 1/(n ? 1) times, on average, as if there were only one coauthor. We can imagine that the researcher divides his or
- 4. Team #30254 Page 2 of 15 her time equally between the (n ? 1) coauthors. This is obviously only a rough approximation. In reality a researcher spends more time with some coauthors than with others, so the proportion each of them contributes varies. The weight of erdos1 authorsˇŻ in?uence is assumed to be the same in this paper, since the information given is not concrete enough for us to distinguish. Other factors like degree distribution, core number, and power ranking are taken into consideration in the process of measurement. The factors involved in the measurement of authors and their papersˇŻ impacts are circled in co-author network and citation counts. Obviously, many other factors would make contribution to the measurement. We choose to simplify the analysis and obtain an ef?cient outcome by omitting the less detailed factors. A problem with the obtained network is due to the non standardized writing of the authorˇŻs name, it contains several characteristics corresponding to the same author. For example: R.S. Dremdale, Lobert L. Dremdale, Lobert L. Scot Dredale, L.L. Dremdale, S. Dremdale, L. Dremdale, and L.L.S. Dremdale ¨C this is relatively easy to guess. Moreover, ˇ°insiderˇ± information is needed to know if Ottry Tchwahzkmpf and Ottry Cheng are the same person. Also, no provision is made in the database to discern two persons with the same name. We then assume the names mentioned in the case are exclusive to them. Each personˇŻs name is different. 3 Basic Models of Network Topology 3.1 Random Network In mathematical terms a network is represented by a graph. A graph is a pair of sets G = {P, E} , where P is a set of N nodes (or vertices or points) P1, P2, . . ., PN and E is a set of edges (or links or lines) that connect two elements of P. Graphs are usually represented as a set of dots, each corresponding to a node, two of these dots being joined by a line if the corresponding nodes are connected.
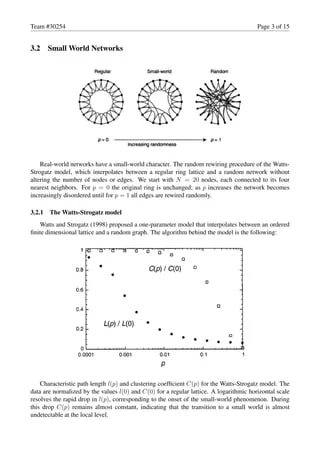
- 5. Team #30254 Page 3 of 15 3.2 Small World Networks Real-world networks have a small-world character. The random rewiring procedure of the Watts- Strogatz model, which interpolates between a regular ring lattice and a random network without altering the number of nodes or edges. We start with N = 20 nodes, each connected to its four nearest neighbors. For p = 0 the original ring is unchanged; as p increases the network becomes increasingly disordered until for p = 1 all edges are rewired randomly. 3.2.1 The Watts-Strogatz model Watts and Strogatz (1998) proposed a one-parameter model that interpolates between an ordered ?nite dimensional lattice and a random graph. The algorithm behind the model is the following: Characteristic path length l(p) and clustering coef?cient C(p) for the Watts-Strogatz model. The data are normalized by the values l(0) and C(0) for a regular lattice. A logarithmic horizontal scale resolves the rapid drop in l(p), corresponding to the onset of the small-world phenomenon. During this drop C(p) remains almost constant, indicating that the transition to a small world is almost undetectable at the local level.
- 6. Team #30254 Page 4 of 15 Start with order: Start with a ring lattice with N nodes in which every node is connected to its ?rst K neighbors (K/2 on either side). In order to have a sparse but connected network at all times, consider N ? K ? ln(N) ? 1 . (2) Randomize: Randomly rewire each edge of the lattice with probability p such that self- connections and duplicate edges are excluded. This process introduces pNK/2 long-range edges which connect nodes that otherwise would be part of different neighborhoods. By varying p one can closely monitor the transition between order (p = 0) and randomness (p = 1). 4 Small World Model 4.1 Introduction of the Small World SIX DEGREES OF SEPERATION: Six degree of separation is a theory which researchers claim that relationship network of the people all over the world could be divided into six degree. An experi- ment has been set to prove this theory. Some participators were required to send an email to a speci?c person totally unfamiliar with them through their own relationship network and it turned out to be amazing that the average time is approximately 6. The distance between a stranger with us is smaller than we have ever imagined, and this phenomenon is a strong-persuaded example of the small world model applying for the analysis of some cooperation networks. 4.2 Erdos collaboration graph Table 1: The growth of Erdos collaboration graph Year No.of co-authors of Erdos 1934-1944 22 1945-1955 35 1956-1966 120 1967-1977 105 1978-1988 159 1989-1999 226 2000-2014 7 From the table above, we can see the number of co-authors of Erdos every ten years and the trend of the number. 4.2.1 Erdo?s number The Erdo?s number nE of an author is de?ned as follows: Paul Erdo?s himself has nE = 0 ; people who have written a joint paper with Paul Erdo?s have nE = 1 ; and their co-authors, with Erdo?s number not yet de?ned, have nE = 2 ; etc. 4.2.2 Network of Erdos1 From the case, there are 510 researchers in the network of Erdos1, we will ?rst analyze some basic information by building the co-author network of the Erdos1 authors.
- 7. Team #30254 Page 5 of 15 4.2.3 Basic Analyses Related data are available at the URL: http://www.oakland.edu/grossmanrerdoshp.html. These data can be represented as a graph called the Erdo?s collaboration graph ˇŞ ¦Ĺ = (V, E) . The set of its vertices V consists of known authors with nE ˇÜ 2 , and its edges connect two authors, if they wrote a joint paper, and at least one of them has nE ˇĘ {0, 1} ˇŞ the data about collaboration among authors with nE = 2 are not available. Based on 510 Erdos1 authors network, some basic statistics about the number of co-authors can be concluded as Table 2. In the Erdos1 co-author network, the smallest degree is 1 compared to the biggest one 97. The maximizer is Abbott, Harvey Leslie. Besides, the average degree is 12.2549, which indicates a relatively high cooperating level. Table 2: Basic statistics on degrees in Erdos collaboration graph nE = 1 Minimum 1 Median 7 Average degree 12.2549 Maximum 97 Maximizer Abbott, Harvey Leslie 5 Core 5.1 De?nition The notion of a core was introduced by Seidman in 1983 [3].Let G = (V, L) be a graph. V is the set of vertices and L is the set of lines (edges or arcs). We will denote n = |V | and m = |L|. A subgraph Hk = (W, L|W) induced by the set W is a k-core or a core of order k iff ?v ˇĘ W: deg H(v) ˇÝ k, and Hk is the maximum subgraph with this property. The core of maximum order is also called the main core. The core number of vertex v is the highest order of a core that contains this vertex.
- 8. Team #30254 Page 6 of 15 0, 1, 2 and 3 core The degree deg(v) can be: in-degree, out-degree, in-degree + out-degree, . . . determining different types of cores. In Figure 1 an example of cores decomposition of a given graph is presented. From this ?gure we can see the following properties of cores: ? The cores are nested:i < j ? Hj ? Hi. ? Cores are not necessarily connected subgraphs. Since the cores can be ef?ciently determined, and also are one among few concepts that provide us with meaningful information of large networks. We expect that different approaches to the analysis of large networks can be built on this basis. 5.2 Case analysis In our paper, the main task is to develop in?uence measurement to determine who in this Erdos1 network has signi?cant in?uence within the network in the consideration of the importance of the published works that connects important researchers within Erdos1. As mentioned above, core num- ber is related to the degree distribution of the author. The person attached to a high core number is at a relatively central position, and this can be viewed as an aspect of the measurement of in?uence. If a person is in a central position, he can make distribution by coauthoring with others directly or passing his ideas to others with familiar co-authorship indirectly. On the other hand, the directly collaboration with others should be de?ned as another aspect of the measurement, and we impose a notion ˇ°coll ˇ° to illustrate an authorˇŻs openness. Obviously, a person who cooperates with researchers in different ?elds rather than the same ?eld s/he is working in can have a better impact on forecasting their papers within the whole academic network.
- 9. Team #30254 Page 7 of 15 Table 3: Top 15 authors according to number of co-authors Author No.of co-authors Core ALON, NOGA M. 97 18 RODL, VOJTECH 84 18 GRAHAM, RONALD LEWIS 84 18 BOLLOBAS, BELA 82 18 TUZA, ZSOLT 77 18 FUREDI, ZOLTAN 77 18 SPENCER, JOEL HAROLD 66 18 GYARFAS, ANDRAS 65 18 CHUNG, FAN RONG KING (GRAHAM) 62 18 PACH, JANOS 61 18 POMERANCE, CARL BERNARD 58 10 FAUDREE, RALPH JASPER, JR. 58 18 ODLYZKO, ANDREW MICHAEL 57 16 SZEMEREDI, ENDRE 57 18 KLEITMAN, DANIEL J. 57 18 We make a ranking of the 510 authors according to the number of their co-authors and pick the top 10 to make a list as table 3. In this table, it could be concluded that Alon, Noga M collaborated with the most authors. In other words, he is the most collaborative author in the network. Also, the core of each person has been listed in our network analysis, and 18 turns out to the biggest core. We name the core 18 to be the main core, which means the person in this core has the relatively stronger in?uence in the network and the in?uence is getting weaker as the core number decreases. From the table four, the second column of the distribution shows the number of coauthors that each core has. Column three to nine are seven person samples showing the distribution of the cores that they most cooperate with. The collection of these seven persons is based on the ranking of the No. of the coauthors. The personˇŞGraham has the highest average number of core (7.44), so we can indicate him to be the person that cooperates the widest range. On the opposite, the personˇŞFuredi has the lowest average number, which means he is the person that doesnˇŻt cooperate so widely.
- 10. Team #30254 Page 8 of 15 core No.of authors ALON RODL GRAHAM BOLLOBAS TUZA FUREDI SPENCER 18 25 1 1 2 1 2 1 1 17 0 0 0 0 0 0 0 0 16 20 3 3 4 0 0 0 2 15 1 0 0 0 0 0 0 0 14 9 0 0 0 2 0 0 0 13 4 0 0 0 1 1 0 0 12 15 1 1 2 1 2 1 1 11 15 1 1 1 0 1 2 1 10 43 5 2 4 5 5 5 3 9 14 0 1 1 1 0 1 0 8 48 2 5 3 6 2 4 4 7 25 2 0 1 0 1 1 0 6 56 10 8 8 5 5 2 8 5 22 3 1 1 1 2 2 1 4 67 2 1 4 6 4 4 1 3 20 4 5 1 2 2 2 3 2 110 14 13 9 8 12 12 8 1 16 0 0 0 0 0 1 0 sum 510 48 42 41 39 39 38 33 average 6.08 6.1 7.44 6.64 6.23 5.76 6.58 Authors and number of their co-authors in the main core, total number of co-authors, average core and average degree of all their co-authors, and their collaborativenessThe authors with the highest values of deg and core are indicated by an asterisk. Author Co-authors All co-authors core deg coll ALON 17 48 14.54 37.98 1.24 BABAI 9 25 13.32 33.36 1.35 BOLLOBAS 13 40 14.03 37.54 1.28 BURR 8 17 14.47 41.12 1.24 CHUNG 12 31 13.61 38.29 1.32 RODL 18 42 14.98 38.36 1.2 SCHELP 10 26 15.19 36.42 1.18 SIMONOVITS 11 22 15.59 46.68 1.15 LUCZAK 11 24 14.29 39.2 1.26 NESETRIL 9 25 13.33 35.88 1.35 PACH 10 31 12.94 34.81 1.39 SPENCER 14 33 13.76 37.73 1.3 SZEMEREDI 13 29 15.76 44.86 1.14 TROTTER 9 16 16.63 51 1.08 TUZA 12 39 13.9 35.26 1.29 WEST 10 28 12.68 33.04 1.42 KLEITMAN 9 29 12.45 34.57 1.45 FRANKL 9 21 15 44.67 1.2 FUREDI 13 38 14.61 38.29 1.23 GOULD 7 18 15.89 41.39 1.13
- 11. Team #30254 Page 9 of 15 GRAHAM 14 42 13.24 35.88 1.36 GYARFAS 15 32 15.38 39.66 1.17 GYORI 7 13 17.08 53.62 1.05 belonging to the main core and some of their characteristics are presented in this table, where deg is the average degree of all co-authors. deg(v) = ? ? ? 0 N(v) = ? 1 |N(v)| ˇĆ uˇĘN(v) deg(u) otherwise Table 4: Top 23 most collaborative authors Author coll KLEITMAN, DANIEL J. 1.46 WEST, DOUGLAS BRENT 1.42 PACH, JANOS 1.39 GRAHAM, RONALD LEWIS 1.36 BABAI, LASZLO 1.35 NESETRIL, JAROSLAV 1.35 CHUNG, FAN RONG KING (GRAHAM) 1.32 SPENCER, JOEL HAROLD 1.31 TUZA, ZSOLT 1.29 BOLLOBAS, BELA 1.28 LUCZAK, TOMASZ 1.26 BURR, STEFAN ANDRUS 1.24 ALON, NOGA M. 1.24 FUREDI, ZOLTAN 1.23 RODL, VOJTECH 1.2 FRANKL, PETER 1.2 SCHELP, RICHARD H. 1.18 GYARFAS, ANDRAS 1.17 SIMONOVITS, MIKLOS 1.15 SZEMEREDI, ENDRE 1.14 GOULD, RONALD J. 1.32 TROTTER, WILLIAM THOMAS, JR 1.08 GYORI, ERVIN 1.05
- 12. Team #30254 Page 10 of 15 Table 5: Top 23 most collaborative authors in main core Author Coll 1 KLEITMAN 1.45 2 WEST 1.42 3 PACH 1.39 4 GRAHAM 1.36 5 NESETRIL 1.35 cdots cdots 19 SIMONOVITS 1.15 20 SZEMEREDI 1.14 21 GOULD 1.13 22 TROTTER 1.08 23 GYORI 1.05 Multi-characteristics have presented in table 6, from which we measure who is the most in?uential person in terms of two aspects. First, being a member of main core represents that s/he has a great in?uence in the whole network, making direct or indirect distribution to others. Secondly, we de?ne two types of person of importance according to their ˇ°collˇ± number in main core. The person with a higher coll number is more collaborative, in other words, s/he does not only share work achievements with ˇ®elitesˇŻ(the persons in the main core) but also has many co-authors in relatively peripheral core, and we call them ˇ®transferorˇŻˇŞ a person that transfers elitesˇŻ great ideas to the whole academic ?eld. Meanwhile, the person with a lower coll number tends to collaborate more often with the people among the main core, comparatively separated from peripheral core. We call them ˇ®insiderˇŻ. Though insiders do not often interact with peripheral person, they have a great effect on main core so insiders are measured signi?cant. According to Table 6, the transferors are Pach, West, Kleitman, Pach and Graham while the insiders are Gyori, Trotter, Gould, Simonovits and Schelp. They all have huge in?uence within the network but in different aspects. 6 Citation In task 3, it is required to compare the signi?cance of a research paper by analyzing the important works that follow from its publication. In other words, we measure the in?uence of ˇ®quoteesˇŻ by discussing the importance of ˇ®quotersˇŻ by quantifying out-degree and core number. Since the average of out-degree and core are the properties of the ˇ®neighborsˇŻ of a vertex, in this case, which equals to quote. Through the ranking of out-degree and core number, we can get the most in?uential paper in this network. First, we check the references of 16 papers and found the co-relationships among them. Then we calculate out-degrees of each paper, whatˇŻs more, we drew an out-degree graph to indicate the relationships among them so that the core ?eld can be divided.
- 13. Team #30254 Page 11 of 15 Table 6: average output degree, core, average core and their collaborativeness. Average output Average degree core core coll Statistical mechanics of complex networks. 1 1 1 1 Scienti?c collaboration networks: II. Shortest paths, weighted networks, and centrality. 1 1 1 1 Identity and search in social networks. 1 1 1 1 Identifying sets of key players in a network. 0 0 0 nil Networks, in?uence, and public opinion formation. 0 0 0 nil On Random Graphs 1 2 2 1 On properties of a well-known graph, or, What is your Ram- seynumber? 0 0 0 nil Power and Centrality: A family of measures, 1 1 1 1 Social network thresholds in the diffusion of innovations, 0 0 0 nil Collective dynamics of ˇ®small-worldˇŻ networks. 1.75 3 1.5 2 Models of core/periphery structures. 0 1 0 nil The structure of scienti?c collaboration networks. 1 1 1 1 Emergence of scaling in random networks. 0.75 3 0.75 4 Navigation in a small world. Nature 1 1 1 1 The structure and function of complex networks. 0 1 0 nil Statistical models for social networks. 0 0 0 nil 5 1 3 9 8 2 4 10 7 6 11 12 13 14 15 16
- 14. Team #30254 Page 12 of 15 Table 7: The name of the books according to numbers in the above table On Random Graphs, Publicationes Mathematicae 1 On properties of a well-known graph 2 Power and Centrality: A family of measures 3 Social network thresholds in the diffusion of innovations 4 Collective dynamics of ˇ®small-worldˇŻ networks 5 Emergence of scaling in random networks 6 Navigation in a small world 7 Models of core/periphery structures 8 Scienti?c collaboration networks: II. Shortest paths, weighted networks, and centrality 9 The structure of scienti?c collaboration networks. 10 Statistical mechanics of complex networks 11 Identity and search in social networks 12 The structure and function of complex networks 13 Identifying sets of key players in a network 14 Networks, in?uence, and public opinion formation 15 Statistical models for social networks 16 From the table above, ?rstly, we can see that the main core is 3 core. The most in?uential papers include collective dynamics of ˇ®small-worldˇŻ networks and Emergence of scaling in random network. That is to say, these two papers have been quoted the most and have strong impacts on other papers. Secondly, the coll of ˇ°Emergence of scaling in random networkˇ± is the biggest, which means that this paper has been quoted by other papers from different cores the most. Hence, it can be assumed that the useful points are adequate and multi-angled in this paper. The ideas are advanced and inspiring in this paper or the writing style is rigorous and easy to understand. 7 To be a more famous actor 7.1 Case background Talent show is an obvious symbol of the modern world. It builds an arena for anyone to get into the sight of the public. We intend to apply our model to discuss this problem, offering some advices to the current actors to be more famous. According to our analysis mentioned above, the agent of the actor needs to ?nd someone that s/he does not only have signi?cant in?uence but also connects the main pool and the new pool which means s/he eagers to work with the new. Since the persons we are discussing are current actors, we put the emphasize more on the in?uence of the existing actors rather than the openness of the existing actors. So the concept of ˇ°coreˇ± and ˇ°collˇ± mentioned above can be applied in this situation. ˇ°Coreˇ± will be used to locate the target actors that the current actor is going to work with. ˇ°Coreˇ± measures the impact of in?uence of the target actors. ˇ°Collˇ± will be used to determine the openness of the target actors. ˇ°Collˇ± is not a key element in this siyuation. A group of comparative suitable target actors can be settled using the ˇ°coreˇ± and deg. In the movie acting ?eld, there is a movie actor called Kevin Bacon showing the same signi?cance as Erdos so that he has been appreciated as the ˇ®center of the movie worldˇŻ. Bacon has cooperated with hundreds of actors, many of which are active in the ?eld. Since our case is aimed at helping an actor to be more famous and in?uential, it is a feasible way for him to cooperate with the most in?uential actor. We randomly selected 10 male actors and 10 female actors who have once cooperated with Bacon in order to set a network among them and calculate the most in?uential actor. A group of data
- 15. Team #30254 Page 13 of 15 to verify this model is followed under. 7.2 Case analysis Table 8: Actors and number of their co-actors in the main core, total number of co-actors, average degree of all their co-actors and their collaborativeness. Actor Co-actor All co-actor core deg coll Ren?ee Zellweger 6 13 6 8 1 Shawnee Smith 5 10 6 8.2 1 Liv Tyler 5 10 6 8.6 1 Rainn Wilson 4 8 6 8.75 1 Troy Garity 4 8 6 8.25 1 ˇ®Rose Byrne 4 8 6 6.5 1 Robert Duvall 3 6 6 7.33 1 John Hurt 3 6 6 7.33 1 James McAvoy 3 6 6 6.67 1 Laurence Belcher 3 6 6 6.67 1 Gregg Henry 3 6 6 8 1 Logan Lerman 3 6 6 6.33 1 Katherine LaNasa 3 6 6 7.33 1 Jennifer Lawrence 3 6 6 6.67 1 Ellen Page 3 6 6 8 1 Molly C. Quinn 3 6 6 9 1 Degree and average degree are two factors evolving with measurement. As the table above, Molly C. QuinnˇŻs average of degree is the highest, which means his co-actors are more collaborative. On the other hand, Renee Zellweger himself collaborates with most actors. So they are all in?uential persons in this network. To give advice, we would provide two choices, ?rst of which is to cooperate with the person with highest degree so that he can help you to make acquaintance with other actors directly, or with the person with highest average of degree so that you can get more chances to cooperate with actors through this personˇŻs co-actors. 8 Conclusion 8.1 Strength ? We introduce the small world model and use software Pajek to extract and analyze data in a skilled way. Applying the small world model, we can sort up the relationship among enormous amount of people ef?ciently. WhatˇŻs more, viewing the relationship among people as a net- work has signi?cant meaning in analyzing many social problems and this model can help us to measure personˇŻs devotion and in?uence with objective criteria. ? Also, the notion of core has been applied in our process of measuring in?uence. The bene?t of de?ning core as criteria is that we could divide people into different cores in which they have different in?uence. In other words, we could measure their in?uence roughly and then
- 16. Team #30254 Page 14 of 15 we analyze their speci?c in?uence according to their own data properties step by step. The core model enables us to make a more detailed, multi-angled and objective conclusion since the ˇ®in?uenceˇŻ can be shown in many aspects. 8.2 Weakness ? When we measure the degree using the program Pajek, if two coauthors work together to write a paper, the program count one time of degree to each author (2 in total), but it should only be counted once. This results in a phenomenon that a personˇŻs really number of coathors is less than the number the program (Pajek) provides which is in the form of the degree of a author. ? Though we have built some models to measure the in?uence of the network, we still donˇŻt have suf?cient data to support and prove our models. The validity of the models we have conducted still needs to be veri?ed. 8.3 Sensitivity Analysis ? When applying the model to the real network, it is very dif?cult to guarantee the data is pure. Data can be affected by many factors like personal variance, region, religion, and the process of the collection. Also the model itself is often too idealistic. In the reality, the number of factors that can in?uence the impact of the paper are large, while the model we build only take limited factors into consideration. When the model applies to the real world, it is very likely that the model canˇŻt suit the actual situation. 8.4 Power of Modeling First of all, measuring individualˇŻs in?uence used to, more or less, be subjective. However, when the measuring system could be a quanti?ed model, many standards will be set. The comments or opinions following with the judgersˇŻ own feelings would be out of consideration. Secondly, it provides a more suf?cient approach to deal with the problems in which there are many complex factors. For instance, it is popular to divide the relationship within the social network into 6 degrees. If you want to be acquaintant with a celebrity, the model could help analyze a shortest and the most feasible way based on your current relationship network. So we can see the bene?ts of model from the above example. Models can solve some problems by setting up quanti?ed structures to make the problems be more intuitive.
- 17. Team #30254 Page 15 of 15 References [1] Vladimir Batagelj*, Andrej Mrvar, Some analyses of ErdoˇŻs collaboration graph, Social Networks 22 2000. 173¨C186. [2] Batagelj, V., Mrvar, A., 1998. Pajek ˇŞ a program for large network analysis. Connections 21 2 , 47¨C57. [3] M. E. J. Newman, The structure and function of complex networks, SIAM Rev.,45(2), 167¨C256. (90 pages). [4] Vladimir Batagelj, Matjaz Zaversnik, An O(m) Algorithm for Cores Decomposition of Networks , 2003. [5] Batagelj, V. and Mrvar, A. (1998) Pajek -A Program for Large Network Analysis,Connections, 21 (2), 47-57. [6] Paul Edelman & Tracey George, Six Degrees of Cass Sunstein: Collaboration Networks in Legal Scholarship, Green Bag 2d, Vol. 11, No. 1, p. 19, 2007 [7] Batagelj, V. and Mrvar, A. (2000) Some Analyses of ErdoˇŻs Collaboration Graph,Social Net- works, 22, 173-186