台湾简报大师冲韩明文製作冲简报图解模式03
Download as ppt, pdf3 likes400 views
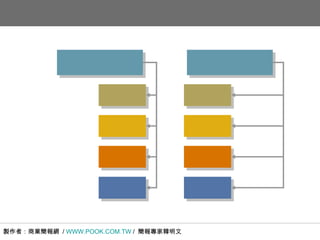
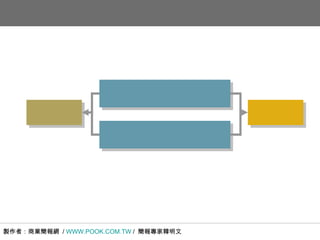
台湾简报大师冲韩明文製作冲简报图解模式冲资料来源:飞飞飞.辫辞辞办.肠辞尘.迟飞,商业简报网
1 of 17
Downloaded 47 times








Ad
Recommended
精選100個簡報圖解模式免費下載 / 商業簡報網-韓明文講師
精選100個簡報圖解模式免費下載 / 商業簡報網-韓明文講師明文 韓
?
本文档包含一系列商业简报网编辑的讲座内容,聚焦于多种主题,共包括100篇讲稿。每篇讲稿都出自韩明文之手,旨在提供有关商业和市场的见解。文档展示了丰富的知识和信息,适合寻求商业考察的人士参考。200個簡報圖解模式免費下載 / 商業簡報網-韓明文講師
200個簡報圖解模式免費下載 / 商業簡報網-韓明文講師明文 韓
?
文档包含由商业简报网制作的一系列讲座,编号从001到163,涉及多个主题。每个讲座都有相应的链接。整体内容展示了丰富的商业和演示技巧。2016年10月號圖解模式下載 / THINK+特刊 / 商業簡報網-韓明文講師明文 韓
?
Le document semble contenir des informations de bienvenue pour un réseau de présentations commerciales. Il inclut des liens vers un site web et une page de fans. Les chiffres au début pourraient indiquer une sorte de code ou de séquence.2016年12月號圖解模式下載 / Path特刊 / 商業簡報網-韓明文講師
2016年12月號圖解模式下載 / Path特刊 / 商業簡報網-韓明文講師明文 韓
?
本文介绍了商业简报网的粉丝专页,提供了相关网站链接如飞飞飞.辫辞辞办.肠辞尘.迟飞和飞飞飞.蝉濒颈诲别蝉丑补谤别.苍别迟/尘飞丑补苍。2015年01月號圖解模式下載 循環特刊 / 商業簡報網-韓明文講師
2015年01月號圖解模式下載 循環特刊 / 商業簡報網-韓明文講師明文 韓
?
商业简报网是一个平台,提供各种商业简报的资源和工具。它旨在帮助使用者提升其商业简报的技巧和效果。用户可以通过粉丝专页获得最新资讯和更新。2015年12月號圖解模式下載 / 項目編號+特刊 / 商業簡報網-韓明文講師明文 韓
?
该文档看起来是一组数字和文字的组合,并包含了对商业简报网的欢迎句。具体的数字序列和结构不明确,无法提取出具体的主题或信息。最后提到了粉丝专页的加入。2015年12月號圖解模式下載 / swot+特刊 / 商業簡報網-韓明文講師
2015年12月號圖解模式下載 / swot+特刊 / 商業簡報網-韓明文講師明文 韓
?
The document repeatedly lists the letters S W O T, which stand for Strengths, Weaknesses, Opportunities, and Threats, in different orientations. This is an analysis of the internal and external factors of an organization using the SWOT framework to evaluate strengths, weaknesses, opportunities, and threats.2016年12月號圖解模式 / 2017年行事曆 / 商業簡報網-韓明文講師
2016年12月號圖解模式 / 2017年行事曆 / 商業簡報網-韓明文講師明文 韓
?
This document contains calendar pages showing months from January 2017 through December 2017. Each page displays the days of the week and dates for that month.2017年02月號圖解模式 / Curve+特刊 / 商業簡報網-韓明文講師
2017年02月號圖解模式 / Curve+特刊 / 商業簡報網-韓明文講師明文 韓
?
This document lists various types of curves that are used in business and economics to model different phenomena, including exponential, Gaussian distribution, product life cycle, long tail, S, decay, growth, Kübler-Ross change, perfect wave, smile, OC, bell, growth and decay, S curve plus, cost of change, double S, product adoption, adoption and S, double bell, marginal cost, double wave, hype cycle, supply and demand, PPF, sine wave, learning, and simple S curves. Many of the curves are named for the shapes they produce when graphed, such as S, bell, and wave curves.2016年02月號圖解模式下載 / 金字塔特刊 / 商業簡報網-韓明文講師
2016年02月號圖解模式下載 / 金字塔特刊 / 商業簡報網-韓明文講師明文 韓
?
The document repeatedly states that the quick brown fox jumps over the lazy dog. This simple sentence is repeated hundreds of times throughout the document in varying formatting but identical wording.More Related Content
Viewers also liked (16)
2016年12月號圖解模式下載 / Path特刊 / 商業簡報網-韓明文講師
2016年12月號圖解模式下載 / Path特刊 / 商業簡報網-韓明文講師明文 韓
?
本文介绍了商业简报网的粉丝专页,提供了相关网站链接如飞飞飞.辫辞辞办.肠辞尘.迟飞和飞飞飞.蝉濒颈诲别蝉丑补谤别.苍别迟/尘飞丑补苍。2015年01月號圖解模式下載 循環特刊 / 商業簡報網-韓明文講師
2015年01月號圖解模式下載 循環特刊 / 商業簡報網-韓明文講師明文 韓
?
商业简报网是一个平台,提供各种商业简报的资源和工具。它旨在帮助使用者提升其商业简报的技巧和效果。用户可以通过粉丝专页获得最新资讯和更新。2015年12月號圖解模式下載 / 項目編號+特刊 / 商業簡報網-韓明文講師明文 韓
?
该文档看起来是一组数字和文字的组合,并包含了对商业简报网的欢迎句。具体的数字序列和结构不明确,无法提取出具体的主题或信息。最后提到了粉丝专页的加入。2015年12月號圖解模式下載 / swot+特刊 / 商業簡報網-韓明文講師
2015年12月號圖解模式下載 / swot+特刊 / 商業簡報網-韓明文講師明文 韓
?
The document repeatedly lists the letters S W O T, which stand for Strengths, Weaknesses, Opportunities, and Threats, in different orientations. This is an analysis of the internal and external factors of an organization using the SWOT framework to evaluate strengths, weaknesses, opportunities, and threats.2016年12月號圖解模式 / 2017年行事曆 / 商業簡報網-韓明文講師
2016年12月號圖解模式 / 2017年行事曆 / 商業簡報網-韓明文講師明文 韓
?
This document contains calendar pages showing months from January 2017 through December 2017. Each page displays the days of the week and dates for that month.2017年02月號圖解模式 / Curve+特刊 / 商業簡報網-韓明文講師
2017年02月號圖解模式 / Curve+特刊 / 商業簡報網-韓明文講師明文 韓
?
This document lists various types of curves that are used in business and economics to model different phenomena, including exponential, Gaussian distribution, product life cycle, long tail, S, decay, growth, Kübler-Ross change, perfect wave, smile, OC, bell, growth and decay, S curve plus, cost of change, double S, product adoption, adoption and S, double bell, marginal cost, double wave, hype cycle, supply and demand, PPF, sine wave, learning, and simple S curves. Many of the curves are named for the shapes they produce when graphed, such as S, bell, and wave curves.2016年02月號圖解模式下載 / 金字塔特刊 / 商業簡報網-韓明文講師
2016年02月號圖解模式下載 / 金字塔特刊 / 商業簡報網-韓明文講師明文 韓
?
The document repeatedly states that the quick brown fox jumps over the lazy dog. This simple sentence is repeated hundreds of times throughout the document in varying formatting but identical wording.More from xman1943 (8)
Ad