1 Leed Smart Meter Presentation
- 1. The Relationship between LEED Certification & Student Performance In K-12 Schools in Texas Ron Neumond URP 521 Research Design for Planning
- 2. Why ? The main focus of the process is to reinforce optimal learning, a goal very much in keeping with the parallel goals of resource efficiency and minimal pollution. Such buildings provide clean fresh air, a comfortable temperature range, abundant light, and low distraction from unwanted noise while also maximizing resource efficiency, minimizing pollution, and teaching students the importance of innovation in the built environment. Numerous studies have demonstrated direct benefits to student health and performance. ŌĆō daylight improves performance. ŌĆō good indoor air quality improves health. ŌĆō acoustics increases learning potential. ŌĆō comfortable indoor temperatures increase occupant satisfaction.
- 3. Research Topic: The Relationship between LEED Certification and Student Performance in K-12 Schools Research Question: What is the impact of a LEED certified school on a studentŌĆÖs academic performance in Texas? + LEED Certified School ’āĀ Student Performance
- 4. Research Methodology: ŌĆó Inductive approach. ŌĆó Independent variable is the presence or absence of LEED Certification for a school. ŌĆó Dependent variable is student performance. ŌĆó The unit of analysis is schools. ŌĆó Research will compare the academic performance as measured by the Texas Assessment of Knowledge and Skills (TAKS) test of students who attend LEED certified schools with those students who attend non-LEED certified schools of comparable size within same or adjacent district.
- 5. Research Sample 85 Registered LEED Certified Schools in Texas, 2010 Schools with status of ŌĆ£ConfidentialŌĆØ, Charter Schools, Magnet Schools, schools which opened in Aug. 2010, or will open Aug. 2011 (& beyond) year were eliminated from sample. All remaining schools were included in the research. 25 LEED Certified -vs- Non-Certified Schools 19 Elementary Schools 1 Middle School 5 High Schools
- 6. Who takes the TAKS test? Elementary School Middle School High School 3rd 4th 5th Grade 6th 7th 8th Grade 9th Grade 10th 11th Grade Grade Grade Grade Grade Grade Math Math Math Math Math Math Math Math Math Reading Reading Reading Reading Reading English English English English Language & Language & Language & Language & Arts Arts Arts Arts Writing Science Writing Social Social Social Studies Studies Studies Science Science Science On each test, a scaled score of 2100 is required to pass and 2400 is required to earn "commended" status. Performance standards showing the raw scores are available online @ http://www.tea.state.tx.us/index3.aspx?id=3270&menu_id=793
- 7. Student Learning Gains 2010 ŌĆō Elementary Schools Grades 3-5 100 90 80 70 LEED CERTIFIED - COMMENDABLE 60 PERFORMANCE NON-LEED CERTIFIED - COMMENDABLE 50 PERFORMANCE LEED CERTIFIED - PASSING PERFORMANCE 40 NON-LEED CERTIFIED - PASSING PERFORMANCE 30 20 10 0 Math 1 Reading 2 Math 3 Reading 4 Writing 5 Math 6 Reading 7 Science 8 3rd Grade 4th Grade 5th Grade
- 8. Student Learning Gains 2010 ŌĆō Middle Schools Grades 6-8 100 90 80 70 LEED CERTIFIED - PASSING PERFORMANCE 60 NON-LEED CERTIFIED - PASSING PERFORMANCE 50 LEED CERTIFIED - COMMENDABLE 40 PERFORMANCE NON-LEED CERTIFIED - COMMENDABLE 30 PERFORMANCE 20 10 0 Reading Math Reading Math Writing English Math Social Science 1 2 3 4 5 Language 7 6 8 Studies 9 & Arts 6th Grade 7th Grade 8 Grade th
- 9. Student Learning Gains 2010 ŌĆō High Schools Grades 9-11 120 100 80 LEED CERTIFIED - COMMENDABLE PERFORMANCE NON-LEED CERTIFIED - COMMENDABLE 60 PERFORMANCE LEED CERTIFIED - PASSING PERFORMANCE 40 NON-LEED CERTIFIED - PASSING PERFORMANCE 20 0 Math English Math English Science Social Math English Science Social 1 2 3 4 5 6 7 8 9 10 Language Language Studies Language Studies & Arts & Arts & Arts 9th Grade 10th Grade 11th Grade
- 10. Performance comparison of LEED & Non-Leed Certified schools (used in sample) against all schools in state of Texas. 100 100 100 80 90 90 90 70 80 80 80 60 70 70 70 50 60 60 60 50 50 50 40 40 40 40 30 30 30 30 20 20 20 20 10 10 10 10 0 0 0 0 Elementary School 1 Middle1 School High 1School Overall 1 LEED Commended Non-LEED Commended State Commended LEED Passing Non-LEED Passing State Passing
- 11. Conclusions: LEED Certification Criteria Sustainable Site Improved LEED Water Efficiency + Certified + Performance on Energy & Atmosphere School TAKS Test(s) Materials & Resources Indoor Environmental Quality ŌĆóMore students in LEED Certified schools achieve passing scores on the TAKS test compared to students who attend non-LEED Certified schools. Innovation in Design Regional Priority ŌĆóMore students in LEED Certified schools achieve commended scores on the TAKS test compared to students who attend non-LEED Certified schools. ŌĆóComparing all grade levels, greatest gains appear in Math scores. ŌĆóMost significant difference between scores is demonstrated in High School.
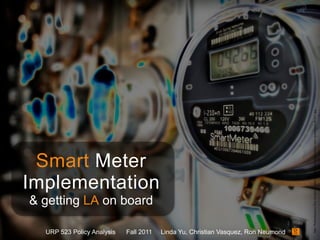
- 12. http://burbankaction.files.wordpress.com/2011/07/stop-smart-meters-now-posterized-photo1.jpg Smart Meter Implementation & getting LA on board URP 523 Policy Analysis Fall 2011 Linda Yu, Christian Vasquez, Ron Neumond
- 13. Defining the Problem There is a lack of unanimous cooperation among LADWPŌĆÖs residential customers in accepting smart meter upgrades into their homes due to uncertainties about the technology. To provide LADWP with an equitable solution for the Goal implementing upgrades incorporating smart meter technology while maintaining transparency and efficiency to maintain customer satisfaction and reduce anxiety. Smart LA / 2 of 9
- 14. The Client & Stakeholders Customers Third Party Policymakers Service Providers Los Angeles Department of Smart Water and Power Meter Program Smart LA / 3 of 9
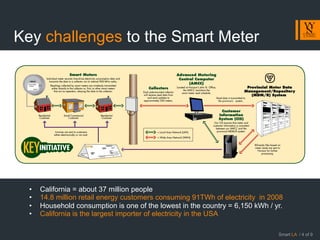
- 15. Key challenges to the Smart Meter ŌĆóŌĆ» xxxxxxxxxxxxxxxxxxx ŌĆóŌĆ» California = about 37 million people ŌĆóŌĆ» 14.8 million retail energy customers consuming 91TWh of electricity in 2008 ŌĆóŌĆ» Household consumption is one of the lowest in the country = 6,150 kWh / yr. ŌĆóŌĆ» California is the largest importer of electricity in the USA Smart LA / 4 of 9
- 16. Alternatives matrix Education & Incentives Installation Methods Public Relations ŌĆóŌĆ» BMP / Training / ŌĆóŌĆ» Workshops ŌĆóŌĆ» Free Monitoring Devices Certification / Background Checks ŌĆóŌĆ» PSAŌĆÖs ŌĆóŌĆ» Dynamic Pricing ŌĆóŌĆ» Seasonal Installation ŌĆóŌĆ» Intercepts / Face 2 Face ŌĆóŌĆ» Substantial Notification & ŌĆóŌĆ» Rebates Solicitation Staged Messaging ŌĆóŌĆ» Smart Meter Taskforce / ŌĆóŌĆ» On-Line Monitoring ŌĆóŌĆ» Billboards & Door Hangers Helpline & Online Systems Assistance ŌĆóŌĆ» ŌĆ£Reduce Energy UseŌĆØ ŌĆóŌĆ» Direct Mail & Bill Inserts ŌĆóŌĆ» Alerts via Text & Phone Competition Smart LA / 5 of 9
- 17. Alternatives & Evaluation matrix Education & Incentives Installation Methods Public Relations Address & Reduce 4.4 4 3.2 Anxiety Equity 3.3 3.6 2.1 Effectiveness 2 2.4 1.6 Administrative Feasibility 1.2 0.8 0.9 Total 10.9 10.8 7.8 Smart LA / 6 of 9
- 18. Recommendation & Implementation Education & Incentives Installation Methods Public Relations 1st Place 2nd Place 1st Place 2nd Place 1st Place 2nd Place Free Dynamic BMP Substantial Workshops Intercepts Devices Pricing Training & Staged Messaging $ 2.7 $ 0.5 $ 88 $ 117 $ 1.7 $ 18.3 Cost Million Million Million Million Million Million implementation ŌĆóŌĆ» Pre-deployment Education ŌĆóŌĆ» Free Devices ŌĆóŌĆ» 30-60-90 Staged Messaging ŌĆóŌĆ» BMP / Contractors Smart LA / 7 of 9
- 19. Smart ┬ĀMeter ┬Ā/ ┬ĀAMD ┬Ā ┬Ā http://emrabc.ca/wp-content/uploads/2010/07/meter1.jpg Toys & Materials Smart ┬ĀMeter ┬ĀFramed ┬ĀMonitor ┬Ā Smart ┬ĀMeter ┬ĀDoor ┬ĀHangers ┬Ā http://www.glendalenewspress.com/media/photo/ http://asset.sce.com/Images/ 2011-09/246595220-02171051.jpg Shared/door_hanger.jpg Smart LA / 8 of 9
- 20. Questions? ŌĆ”& Thank You! http://gigaom2.files.wordpress.com/2011/03/cloud_powerlines_streetlamps.jpg


