ºÝºÝߣ

ºÝºÝߣShare a Scribd company logo
Friday, January 25, 2013


                      Graph of Functions


                           EN.AIRIL BIN AHMAD


                                                AIRIL AHMAD
1


Friday, January 25, 2013
     −6       −4       −2           2     4
                                                 x

                                                 6


                            −1


                            −2


                    Graph   −3


                            −4


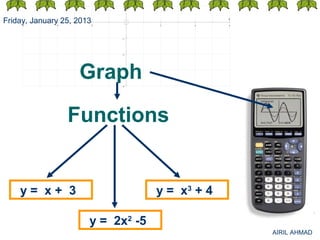
                   Functions


    y= x+ 3                         y = x3 + 4

                       y = 2x2 -5
                                                     AIRIL AHMAD
Friday, January 25, 2013


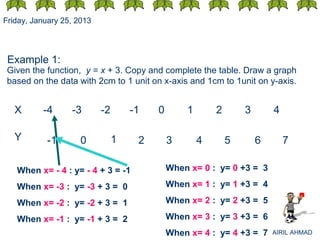
 Example 1:
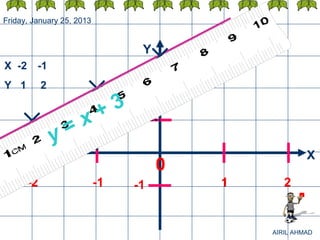
 Given the function, y = x + 3. Copy and complete the table. Draw a graph
 based on the data with 2cm to 1 unit on x-axis and 1cm to 1unit on y-axis.


   X      -4      -3       -2       -1   0       1       2       3       4

   Y        -1       0          1    2       3       4       5       6       7

   When x= - 4 : y= - 4 + 3 = -1             When x= 0 : y= 0 +3 = 3

   When x= -3 : y= -3 + 3 = 0                When x= 1 : y= 1 +3 = 4

   When x= -2 : y= -2 + 3 = 1                When x= 2 : y= 2 +3 = 5

   When x= -1 : y= -1 + 3 = 2                When x= 3 : y= 3 +3 = 6
                                             When x= 4 : y= 4 +3 = 7     AIRIL AHMAD
Friday, January 25, 2013


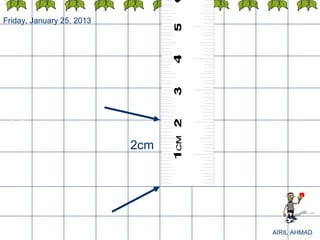
                           2cm


                                 AIRIL AHMAD
Friday, January 25, 2013


                           2cm


                                 AIRIL AHMAD
Friday, January 25, 2013


                                Y
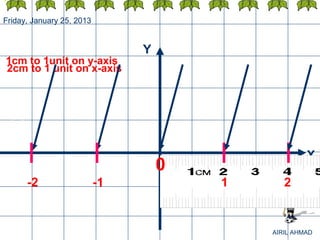
1cm to 1unit on y-axis
2cm to 1 unit on x-axis


                                                     X
                                    0
      -2                   -1           1      2


                                            AIRIL AHMAD
Friday, January 25, 2013


                                 Y
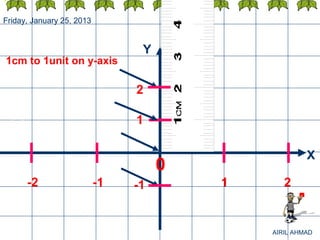
1cm to 1unit on y-axis

                                2

                                1

                                                      X
                                     0
      -2                   -1   -1       1      2


                                             AIRIL AHMAD
Friday, January 25, 2013


 Example 1:
 Given the function, y = x + 3. Copy and complete the table. Draw a graph
 based on the data with 2cm to 1 unit on x-axis and 1cm to 1unit on y-axis.


   X      -4      -3       -2       -1   0       1       2       3       4

   Y        -1       0          1    2       3       4       5       6       7

   When x= - 4 : y= - 4 + 3 = -1             When x= 0 : y= 0 +3 = 3

   When x= -3 : y= -3 + 3 = 0                When x= 1 : y= 1 +3 = 4

   When x= -2 : y= -2 + 3 = 1                When x= 2 : y= 2 +3 = 5

   When x= -1 : y= -1 + 3 = 2                When x= 3 : y= 3 +3 = 6
                                             When x= 4 : y= 4 +3 = 7     AIRIL AHMAD
Friday, January 25, 2013


                                   Y
X -2 -1
Y 1        2                      2
                            + 3
                   = x            1
               y
                                                        X
                                       0
      -2                   -1     -1       1      2


                                               AIRIL AHMAD
Friday, January 25, 2013


 Example 2:
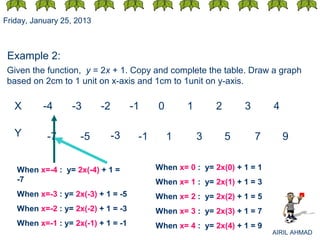
 Given the function, y = 2x + 1. Copy and complete the table. Draw a graph
 based on 2cm to 1 unit on x-axis and 1cm to 1unit on y-axis.

   X      -4      -3       -2        -1    0       1       2       3       4

   Y        -7       -5         -3    -1       1       3       5       7       9


   When x=-4 : y= 2x(-4) + 1 =             When x= 0 : y= 2x(0) + 1 = 1
   -7                                      When x= 1 : y= 2x(1) + 1 = 3
   When x=-3 : y= 2x(-3) + 1 = -5          When x= 2 : y= 2x(2) + 1 = 5
   When x=-2 : y= 2x(-2) + 1 = -3          When x= 3 : y= 2x(3) + 1 = 7
   When x=-1 : y= 2x(-1) + 1 = -1          When x= 4 : y= 2x(4) + 1 = 9
                                                                           AIRIL AHMAD
−3


Friday, January 25, 2013   −4


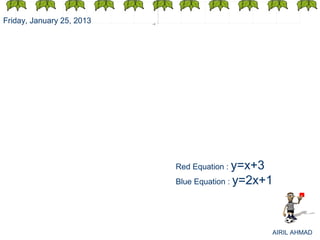
                                Red Equation : y=x+3
                                Blue Equation : y=2x+1


                                                       AIRIL AHMAD
Friday, January 25, 2013


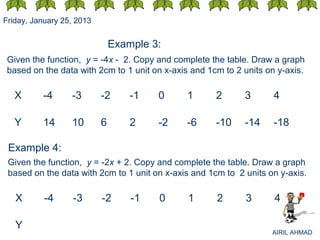
                               Example 3:
 Given the function, y = -4x - 2. Copy and complete the table. Draw a graph
 based on the data with 2cm to 1 unit on x-axis and 1cm to 2 units on y-axis.

   X      -4      -3       -2      -1   0      1      2      3       4

   Y      14      10       6       2    -2     -6     -10    -14     -18

 Example 4:
 Given the function, y = -2x + 2. Copy and complete the table. Draw a graph
 based on the data with 2cm to 1 unit on x-axis and 1cm to 2 units on y-axis.

   X       -4      -3      -2      -1   0      1      2      3       4

   Y
                                                                    AIRIL AHMAD
−4
Friday, January 25, 2013


                                Red equations : y= -4x-2
                                Blue equations: y= -2x+4


                                                     AIRIL AHMAD
Friday, January 25, 2013


                           AIRIL AHMAD
Friday, January 25, 2013


                               Example 5:
 Given the function, y = x2 - 4. Copy and complete the table. Draw a graph
 based on the data with 2cm to 1 unit on x-axis and 1cm to 2 units on y-axis.

   X      -4      -3       -2      -1   0      1      2       3      4

   Y      12      5        0       -3   -4     -3     0       5      12

 Example 6:
 Given the function, y = 12 -x2 . Copy and complete the table. Draw a graph
 based on the data with 2cm to 1 unit on x-axis and 1cm to 2units on y-axis.

   X       -4      -3      -2      -1   0      1      2       3      4

   Y       -4      3       8       11   12     11     8       3      -4
                                                                     AIRIL AHMAD
Friday, January 25, 2013


                           AIRIL AHMAD
−2


Friday, January 25, 2013
                           −4


                                Red Equation : y=  x²+2
                                Blue Equation : y= 6-x²


                                             AIRIL AHMAD
Friday, January 25, 2013


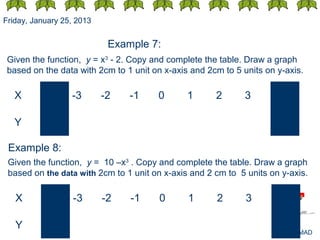
                            Example 7:
 Given the function, y = x3 - 2. Copy and complete the table. Draw a graph
 based on the data with 2cm to 1 unit on x-axis and 2cm to 5 units on y-axis.

   X              -3       -2   -1     0       1      2       3

   Y

 Example 8:
 Given the function, y = 10 –x3 . Copy and complete the table. Draw a graph
 based on the data with 2cm to 1 unit on x-axis and 2 cm to 5 units on y-axis.

   X               -3      -2   -1      0      1      2       3

   Y
                                                                     AIRIL AHMAD
−4       −3       −2        −1   1   2      3        4


 Friday, January 25, 2013


                                     Red Equation : y=  x³+2
                                     Blue Equation : y= 10 - x³


                                                         AIRIL AHMAD
Friday, January 25, 2013


                       Use your finger to represent:
                                    Y=x
                                   Y=-x
                                   Y= x2
                                   Y= -x2
                                   Y= x3
                                   Y= -x3


                                                       AIRIL AHMAD
Friday, January 25, 2013


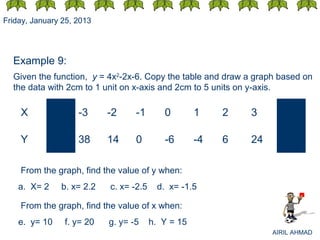
  Example 9:
  Given the function, y = 4x2-2x-6. Copy the table and draw a graph based on
  the data with 2cm to 1 unit on x-axis and 2cm to 5 units on y-axis.

    X               -3     -2     -1       0        1    2   3

    Y               38     14     0        -6       -4   6   24

    From the graph, find the value of y when:
    a. X= 2    b. x= 2.2   c. x= -2.5    d. x= -1.5

    From the graph, find the value of x when:
    e. y= 10    f. y= 20   g. y= -5     h. Y = 15
                                                                  AIRIL AHMAD
Friday, January 25, 2013


                           AIRIL AHMAD

More Related Content

NOTE MATH FORM 3 - 13b graf intro

  • 1. Friday, January 25, 2013 Graph of Functions EN.AIRIL BIN AHMAD AIRIL AHMAD
  • 2. 1 Friday, January 25, 2013 −6 −4 −2 2 4 x 6 −1 −2 Graph −3 −4 Functions y= x+ 3 y = x3 + 4 y = 2x2 -5 AIRIL AHMAD
  • 3. Friday, January 25, 2013 Example 1: Given the function, y = x + 3. Copy and complete the table. Draw a graph based on the data with 2cm to 1 unit on x-axis and 1cm to 1unit on y-axis. X -4 -3 -2 -1 0 1 2 3 4 Y -1 0 1 2 3 4 5 6 7 When x= - 4 : y= - 4 + 3 = -1 When x= 0 : y= 0 +3 = 3 When x= -3 : y= -3 + 3 = 0 When x= 1 : y= 1 +3 = 4 When x= -2 : y= -2 + 3 = 1 When x= 2 : y= 2 +3 = 5 When x= -1 : y= -1 + 3 = 2 When x= 3 : y= 3 +3 = 6 When x= 4 : y= 4 +3 = 7 AIRIL AHMAD
  • 4. Friday, January 25, 2013 2cm AIRIL AHMAD
  • 5. Friday, January 25, 2013 2cm AIRIL AHMAD
  • 6. Friday, January 25, 2013 Y 1cm to 1unit on y-axis 2cm to 1 unit on x-axis X 0 -2 -1 1 2 AIRIL AHMAD
  • 7. Friday, January 25, 2013 Y 1cm to 1unit on y-axis 2 1 X 0 -2 -1 -1 1 2 AIRIL AHMAD
  • 8. Friday, January 25, 2013 Example 1: Given the function, y = x + 3. Copy and complete the table. Draw a graph based on the data with 2cm to 1 unit on x-axis and 1cm to 1unit on y-axis. X -4 -3 -2 -1 0 1 2 3 4 Y -1 0 1 2 3 4 5 6 7 When x= - 4 : y= - 4 + 3 = -1 When x= 0 : y= 0 +3 = 3 When x= -3 : y= -3 + 3 = 0 When x= 1 : y= 1 +3 = 4 When x= -2 : y= -2 + 3 = 1 When x= 2 : y= 2 +3 = 5 When x= -1 : y= -1 + 3 = 2 When x= 3 : y= 3 +3 = 6 When x= 4 : y= 4 +3 = 7 AIRIL AHMAD
  • 9. Friday, January 25, 2013 Y X -2 -1 Y 1 2 2 + 3 = x 1 y X 0 -2 -1 -1 1 2 AIRIL AHMAD
  • 10. Friday, January 25, 2013 Example 2: Given the function, y = 2x + 1. Copy and complete the table. Draw a graph based on 2cm to 1 unit on x-axis and 1cm to 1unit on y-axis. X -4 -3 -2 -1 0 1 2 3 4 Y -7 -5 -3 -1 1 3 5 7 9 When x=-4 : y= 2x(-4) + 1 = When x= 0 : y= 2x(0) + 1 = 1 -7 When x= 1 : y= 2x(1) + 1 = 3 When x=-3 : y= 2x(-3) + 1 = -5 When x= 2 : y= 2x(2) + 1 = 5 When x=-2 : y= 2x(-2) + 1 = -3 When x= 3 : y= 2x(3) + 1 = 7 When x=-1 : y= 2x(-1) + 1 = -1 When x= 4 : y= 2x(4) + 1 = 9 AIRIL AHMAD
  • 11. −3 Friday, January 25, 2013 −4 Red Equation : y=x+3 Blue Equation : y=2x+1 AIRIL AHMAD
  • 12. Friday, January 25, 2013 Example 3: Given the function, y = -4x - 2. Copy and complete the table. Draw a graph based on the data with 2cm to 1 unit on x-axis and 1cm to 2 units on y-axis. X -4 -3 -2 -1 0 1 2 3 4 Y 14 10 6 2 -2 -6 -10 -14 -18 Example 4: Given the function, y = -2x + 2. Copy and complete the table. Draw a graph based on the data with 2cm to 1 unit on x-axis and 1cm to 2 units on y-axis. X -4 -3 -2 -1 0 1 2 3 4 Y AIRIL AHMAD
  • 13. −4 Friday, January 25, 2013 Red equations : y= -4x-2 Blue equations: y= -2x+4 AIRIL AHMAD
  • 14. Friday, January 25, 2013 AIRIL AHMAD
  • 15. Friday, January 25, 2013 Example 5: Given the function, y = x2 - 4. Copy and complete the table. Draw a graph based on the data with 2cm to 1 unit on x-axis and 1cm to 2 units on y-axis. X -4 -3 -2 -1 0 1 2 3 4 Y 12 5 0 -3 -4 -3 0 5 12 Example 6: Given the function, y = 12 -x2 . Copy and complete the table. Draw a graph based on the data with 2cm to 1 unit on x-axis and 1cm to 2units on y-axis. X -4 -3 -2 -1 0 1 2 3 4 Y -4 3 8 11 12 11 8 3 -4 AIRIL AHMAD
  • 16. Friday, January 25, 2013 AIRIL AHMAD
  • 17. −2 Friday, January 25, 2013 −4 Red Equation : y= x²+2 Blue Equation : y= 6-x² AIRIL AHMAD
  • 18. Friday, January 25, 2013 Example 7: Given the function, y = x3 - 2. Copy and complete the table. Draw a graph based on the data with 2cm to 1 unit on x-axis and 2cm to 5 units on y-axis. X -3 -2 -1 0 1 2 3 Y Example 8: Given the function, y = 10 –x3 . Copy and complete the table. Draw a graph based on the data with 2cm to 1 unit on x-axis and 2 cm to 5 units on y-axis. X -3 -2 -1 0 1 2 3 Y AIRIL AHMAD
  • 19. −4 −3 −2 −1 1 2 3 4 Friday, January 25, 2013 Red Equation : y= x³+2 Blue Equation : y= 10 - x³ AIRIL AHMAD
  • 20. Friday, January 25, 2013 Use your finger to represent: Y=x Y=-x Y= x2 Y= -x2 Y= x3 Y= -x3 AIRIL AHMAD
  • 21. Friday, January 25, 2013 Example 9: Given the function, y = 4x2-2x-6. Copy the table and draw a graph based on the data with 2cm to 1 unit on x-axis and 2cm to 5 units on y-axis. X -3 -2 -1 0 1 2 3 Y 38 14 0 -6 -4 6 24 From the graph, find the value of y when: a. X= 2 b. x= 2.2 c. x= -2.5 d. x= -1.5 From the graph, find the value of x when: e. y= 10 f. y= 20 g. y= -5 h. Y = 15 AIRIL AHMAD
  • 22. Friday, January 25, 2013 AIRIL AHMAD