2 Aliasing (1).pdf
- 1. Aliasing Dr. Ali Hussein Muqaibel ver. 4.4 G(?) +2?B ? ?2?B ?s ??s/2 ??s A ?s/2 Sampling Frequency Half the Sampling Frequency Frequency range of input signal above half the sampling frequency G(?) +2?B ?2?B ?s ??s/2 ??s A ?s/2 Sampling Frequency Half the Sampling Frequency Frequency range of input signal above half the sampling frequency Not only the above range is affected (damaged) by aliasing but all of this frequency range ... ?s¨C2?B ...
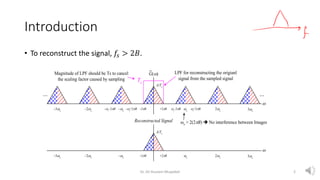
- 2. Introduction ? To reconstruct the signal, ?? > 2?. Dr. Ali Hussein Muqaibel 2 G(?) +2?B ? ?2?B ?s ??s ??s ???s ??s ???s A/Ts ... ... ?s+2?B ?s¨C2?B ??s+2?B ??s¨C2?B LPF for reconstructing the origianl signal from the sampled signal Reconstructed Signal +2?B ?2?B ?s ??s ??s ???s ??s ???s A/Ts Ts Magnitude of LPF should be Ts to cancel the scaling factor caused by sampling ?s > 2(2?B) ? No interference between Images ?
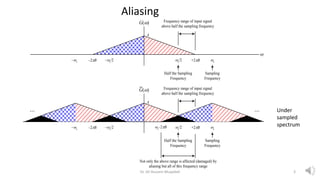
- 3. Aliasing G(?) +2?B ? ?2?B ?s ??s/2 ??s A ?s/2 Sampling Frequency Half the Sampling Frequency Frequency range of input signal above half the sampling frequency G(?) +2?B ?2?B ?s ??s/2 ??s A ?s/2 Sampling Frequency Half the Sampling Frequency Frequency range of input signal above half the sampling frequency Not only the above range is affected (damaged) by aliasing but all of this frequency range ... ?s¨C2?B ... Under sampled spectrum Dr. Ali Hussein Muqaibel 3
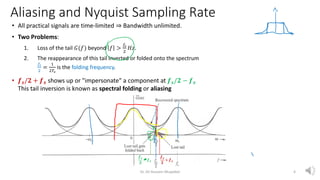
- 4. Aliasing and Nyquist Sampling Rate ? All practical signals are time-limited ? Bandwidth unlimited. ? Two Problems: 1. Loss of the tail ?(?) beyond ? > ?? 2 ??. 2. The reappearance of this tail inverted or folded onto the spectrum ?? 2 = 1 2?? is the folding frequency. ? ??/? + ?? shows up or "impersonate" a component at ??/? ? ?? This tail inversion is known as spectral folding or aliasing Dr. Ali Hussein Muqaibel 4 ?? ? + ?? ?? ? ? ??
- 5. Anti-Alias Filter Anti-Aliasing LPF BW = ?s/2 rad/s = fs/2 Hz Sampler Sampling Freq. = fs samples/s Reconstruction LPF BW = ?s/2 rad/s = fs/2 Hz g(t) g*(t) g*(t) gRecons(t) [= g*(t)] G(?) +2?B ? ?2?B ?s ??s /2 ??s A ?s /2 Sampling Frequency Half the Sampling Frequency Frequency range of input signal above half the sampling frequency G*(?) +2?B ?2?B ?s ??s/2 ??s A ?s/2 Sampling Frequency Half the Sampling Frequency Frequency range of input signal above half the sampling frequency Because the original input signal was filtered, non of images will intefer with adjacent images ... ?s¨C2?B ... G*(?) +2?B ? ?2?B ?s ??s/2 ??s A ?s/2 Sampling Frequency Half the Sampling Frequency This range of the input signal above half the sampling frequency was filtered out Output of Anti-Aliasing Filter bandlimited to ?s/2 (This is the signal input to the sampler) GRecons(?) +2?B ? ?2?B ?s ??s/2 ??s A ?s/2 Sampling Frequency Half the Sampling Frequency This part of the original input signal is lost To SAVE HALF of the signal in the frequency range [?? ? ? , ?] solution (Anti-aliasing filter) use an ideal low pass filter of bandwidth ??/2 before sampling. Practically, use a steep cutoff filter which leaves a sharply attenuated residual after ??/2. Dr. Ali Hussein Muqaibel 5
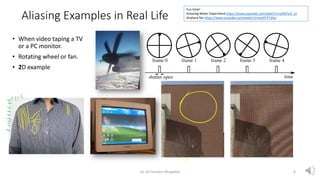
- 6. Aliasing Examples in Real Life ? When video taping a TV or a PC monitor. ? Rotating wheel or fan. ? 2D example Dr. Ali Hussein Muqaibel 6 Fun time! Amazing Water Experiment https://www.youtube.com/watch?v=uENITui5_jU Airplane fan https://www.youtube.com/watch?v=vIsS4TP73AU
- 7. Examples: Aliasing of Sinusoidal Signals Frequency of signals = 1100 Hz, Sampling frequency = 2000Hz Frequency of signals = 1800 Hz, Sampling frequency = 2000Hz Dr. Ali Hussein Muqaibel 7 What is the reconstructed frequency? 900 Hz What is the reconstructed frequency?
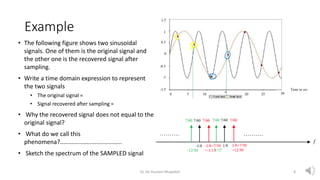
- 8. Example ? The following figure shows two sinusoidal signals. One of them is the original signal and the other one is the recovered signal after sampling. ? Write a time domain expression to represent the two signals ? The original signal = ? Signal recovered after sampling = ? Why the recovered signal does not equal to the original signal? ? What do we call this phenomena?..................................... ? Sketch the spectrum of the SAMPLED signal Dr. Ali Hussein Muqaibel 8

![Anti-Alias Filter
Anti-Aliasing
LPF
BW = ?s/2 rad/s
= fs/2 Hz
Sampler
Sampling Freq.
= fs samples/s
Reconstruction
LPF
BW = ?s/2 rad/s
= fs/2 Hz
g(t)
g*(t) g*(t)
gRecons(t)
[= g*(t)]
G(?)
+2?B
?
?2?B ?s
??s
/2
??s
A
?s
/2
Sampling
Frequency
Half the Sampling
Frequency
Frequency range of input signal
above half the sampling frequency
G*(?)
+2?B
?2?B ?s
??s/2
??s
A
?s/2
Sampling
Frequency
Half the Sampling
Frequency
Frequency range of input signal
above half the sampling frequency
Because the original input signal was filtered, non of
images will intefer with adjacent images
...
?s¨C2?B
...
G*(?)
+2?B
?
?2?B ?s
??s/2
??s
A
?s/2
Sampling
Frequency
Half the Sampling
Frequency
This range of the input signal above
half the sampling frequency was
filtered out
Output of Anti-Aliasing Filter
bandlimited to ?s/2
(This is the signal input to the sampler)
GRecons(?)
+2?B
?
?2?B ?s
??s/2
??s
A
?s/2
Sampling
Frequency
Half the Sampling
Frequency
This part of the original
input signal is lost
To SAVE HALF of the signal in the frequency range
[?? ? ? , ?]
solution (Anti-aliasing filter) use an ideal low pass
filter of bandwidth ??/2 before sampling.
Practically, use a steep cutoff filter which leaves a
sharply attenuated residual after ??/2.
Dr. Ali Hussein Muqaibel 5](https://image.slidesharecdn.com/2aliasing1-230803065255-1edf116e/85/2-Aliasing-1-pdf-5-320.jpg)
