2013 Internet Trends
- 1. Source: KPCB Internet Trends 2013 Ad It Up Although we spend a mere 6% of our media consumption time with paper and ink, that space attracts 23% of all ad spending5 Things You Need to Know from Mary Meeker's 2013 Internet Trends Report
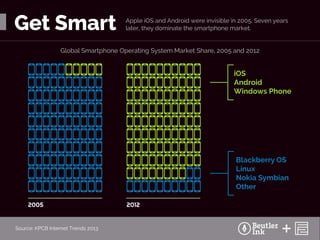
- 2. iOS Android Windows Phone Blackberry OS Linux Nokia Symbian Other Source: KPCB Internet Trends 2013 Get Smart Global Smartphone Operating System Market Share, 2005 and 2012 Apple iOS and Android were invisible in 2005. Seven years later, they dominate the smartphone market. 2005 2012
- 3. Source: KPCB Internet Trends 2013 On the other hand, we spend 12% of our time on mobile, but it attracts only 3% of ad spending 80% of the top 10 global Internet properties are based in the US Source: KPCB Internet Trends 2013 Yet, 81% of users of American Internet properties are based outside the US Domained in the USA Google MONTHLY UNIQUE VISITORS (MMs) 0 200 400 600 800 1000 1200 Microsoft Facebook Yahoo! Wikipedia Amazon.com Apple Glam Media Tencent US users International users
- 4. Source: KPCB Internet Trends 2013 The State of Social “Which of the following social media do you use?” Facebook was the only major social media platform with declining usage in 2012 20%0 40% 60% 80% 100% PERCENT OF RESPONDENTS 2012 2011
- 5. Source: KPCB Internet Trends 2013 Ad It Up Although we spend a mere 6% of our media consumption time with paper and ink, that space attracts 23% of all ad spending On the other hand, we spend 12% of our time on mobile, but it attracts only 3% of ad spending 0% 10% ~$12 BIL Opportunity in US 20% 30% Print Mobile 23% 12% 3% 6% % of Time Spent in Media vs % of Advertising Spending, US 2012 time spent ad spend %ofTotalMediaConsumptionTime orAdvertisingSpending Source: KPCB Internet Trends 2013 Ad It Up Although we spend a mere 6% of our media consumption time with paper and ink, that space attracts 23% of all ad spending On the other hand, we spend 12% of our time on mobile, but it attracts only 3% of ad spending 0% 10% ~$12 BIL Opportunity in US 20% 30% Print Mobile 23% 12% 3% 6% % of Time Spent in Media vs % of Advertising Spending, US 2012 time spent ad spend %ofTotalMediaConsumptionTime orAdvertisingSpending
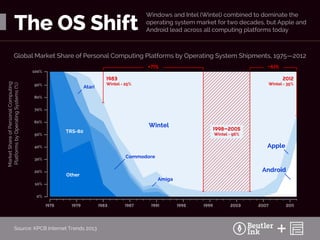
- 6. Source: KPCB Internet Trends 2013 The OS Shift Global Market Share of Personal Computing Platforms by Operating System Shipments, 1975—2012 MarketShareofPersonalComputing PlatformsbyOperatingSystems(%) Windows and Intel (Wintel) combined to dominate the operating system market for two decades, but Apple and Android lead across all computing platforms today 1975 1979 1983 1987 1991 1995 1999 2003 2007 2011 0% 100% 1983 Wintel - 25% 2012 Wintel - 35% Other TRS-80 Atari Commodore Amiga Wintel Apple Android 10% 20% 30% 40% 50% 60% 70% 80% 90% 1998—2005 Wintel - 96% -61%+71%


