3 work charting_methods
•Download as PPTX, PDF•
2 likes•3,755 views

This document discusses various work charting methods used to analyze processes and jobs. It describes Pareto charts, fishbone diagrams, operations process charts, flow process charts, flow diagrams, worker and machine process charts, gang process charts, and two-handed process charts. The charts break down work into tasks, identify contributors to problems, and document the sequence, timing, and flow of operations performed by workers, machines, and materials through a process.


3 work charting_methods
- 2. Objective • Objectively document the work task or process for analysis • Many methods are available • New ones are invented regularly • Break down the job into sub-components or tasks • Describe the tasks in a meaningful way 16 February 2015 King Saud University College of Engineering Department of Industrial Engineering 2
- 3. Pareto Chart • Items of interest are identified and measured on a common scale • Then ordered in ascending order, creating a cumulative distribution 16 February 2015 King Saud University College of Engineering Department of Industrial Engineering 3
- 4. Pareto Chart • Pareto principle: 80% of the total activity can be found in the first 20% of the items. • Goal is to identify the appropriate 20% for analysis. – 80% of inventory is associated with 20% of the parts. – 80% of the injuries are associated with 20% of the jobs. 16 February 2015 King Saud University College of Engineering Department of Industrial Engineering 4
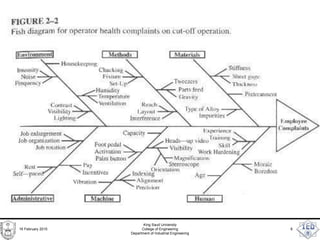
- 5. Fishbone Diagram (Cause-Effect) • Identifies components lead to undesirable (desirable) event in a process • Principle event is identified at the fish head • Associated contributing factors are identified using a tree type structure. • Closely related to many different charts used in safety analysis (Fault-Tree method) 16 February 2015 King Saud University College of Engineering Department of Industrial Engineering 5
- 6. Example 16 February 2015 King Saud University College of Engineering Department of Industrial Engineering 6
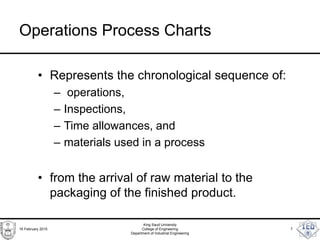
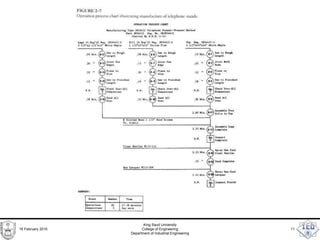
- 7. Operations Process Charts • Represents the chronological sequence of: – operations, – Inspections, – Time allowances, and – materials used in a process • from the arrival of raw material to the packaging of the finished product. 16 February 2015 King Saud University College of Engineering Department of Industrial Engineering 7
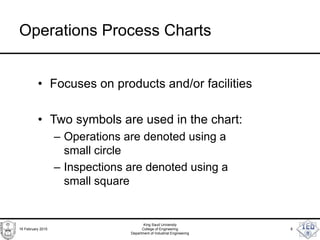
- 8. Operations Process Charts • Focuses on products and/or facilities • Two symbols are used in the chart: – Operations are denoted using a small circle – Inspections are denoted using a small square 16 February 2015 King Saud University College of Engineering Department of Industrial Engineering 8
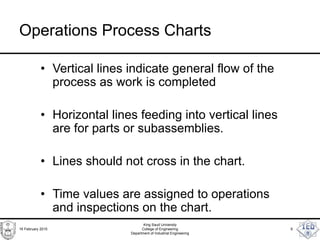
- 9. Operations Process Charts • Vertical lines indicate general flow of the process as work is completed • Horizontal lines feeding into vertical lines are for parts or subassemblies. • Lines should not cross in the chart. • Time values are assigned to operations and inspections on the chart. 16 February 2015 King Saud University College of Engineering Department of Industrial Engineering 9
- 10. 16 February 2015 King Saud University College of Engineering Department of Industrial Engineering 10
- 11. 16 February 2015 King Saud University College of Engineering Department of Industrial Engineering 11
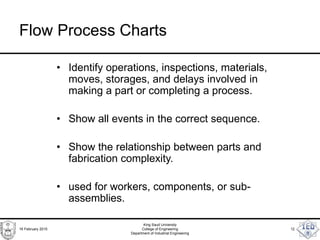
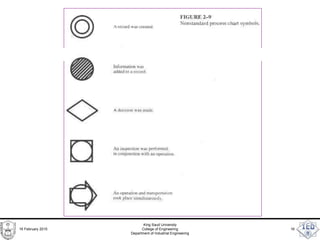
- 12. Flow Process Charts • Identify operations, inspections, materials, moves, storages, and delays involved in making a part or completing a process. • Show all events in the correct sequence. • Show the relationship between parts and fabrication complexity. • used for workers, components, or sub- assemblies. 16 February 2015 King Saud University College of Engineering Department of Industrial Engineering 12
- 13. Flow Process Charts • Distinguish between produced and purchased parts. • Provide information on the number of employees utilized and the time required to perform each operation and inspection. • More details than operations process charts 16 February 2015 King Saud University College of Engineering Department of Industrial Engineering 13
- 14. Flow Process Charts • Two types are commonly used: – Product or material – Operative or person • Help identify nonproduction hidden costs such as distances traveled, delays, and temporary storage. 16 February 2015 King Saud University College of Engineering Department of Industrial Engineering 14
- 15. 16 February 2015 King Saud University College of Engineering Department of Industrial Engineering 15
- 16. 16 February 2015 King Saud University College of Engineering Department of Industrial Engineering 16
- 17. 16 February 2015 King Saud University College of Engineering Department of Industrial Engineering 17
- 18. 16 February 2015 King Saud University College of Engineering Department of Industrial Engineering 18
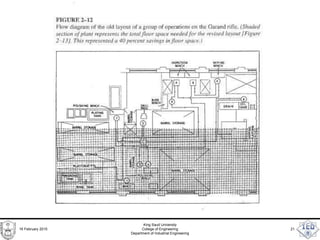
- 19. Flow Diagrams • Supplement to Flow process charts to indicate process flow • Overhead pictorial plan of the facility. 16 February 2015 King Saud University College of Engineering Department of Industrial Engineering 19
- 20. 16 February 2015 King Saud University College of Engineering Department of Industrial Engineering 20
- 21. 16 February 2015 King Saud University College of Engineering Department of Industrial Engineering 21
- 22. Worker and Machine Process Charts • Show time relationship between the working cycle of a person and the operating cycle of a machine(s) at a single workstation. • Machine times and operator times must be known for each element • Chart drawn vertically to scale. 16 February 2015 King Saud University College of Engineering Department of Industrial Engineering 22
- 23. Worker and Machine Process Charts • Solid lines represent productive time, • Breaks indicate idle time, • Dotted lines represent non-productive time. 16 February 2015 King Saud University College of Engineering Department of Industrial Engineering 23
- 24. 16 February 2015 King Saud University College of Engineering Department of Industrial Engineering 24
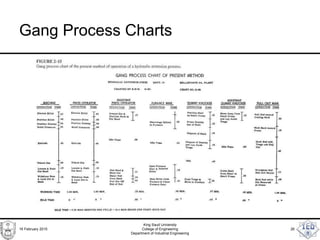
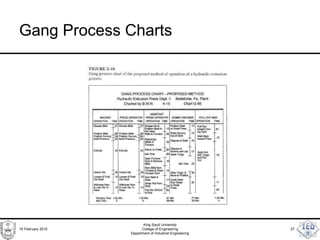
- 25. Gang Process Charts • Worker and Machine Process charts showing many workers are called Gang Process Charts. 16 February 2015 King Saud University College of Engineering Department of Industrial Engineering 25
- 26. Gang Process Charts 16 February 2015 King Saud University College of Engineering Department of Industrial Engineering 26
- 27. Gang Process Charts 16 February 2015 King Saud University College of Engineering Department of Industrial Engineering 27
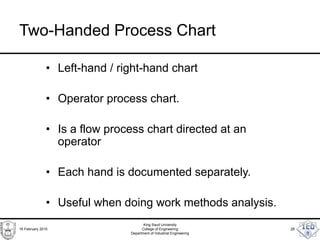
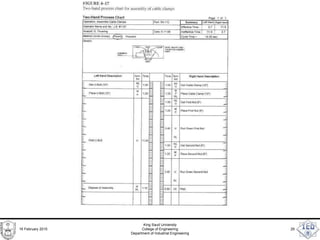
- 28. Two-Handed Process Chart • Left-hand / right-hand chart • Operator process chart. • Is a flow process chart directed at an operator • Each hand is documented separately. • Useful when doing work methods analysis. 16 February 2015 King Saud University College of Engineering Department of Industrial Engineering 28
- 29. 16 February 2015 King Saud University College of Engineering Department of Industrial Engineering 29