Media dwell time
- 1. Time will tell, wonât it ? Why one minute media consumption does not equal one minute consumption of another medium when it comes to advertising efficiency
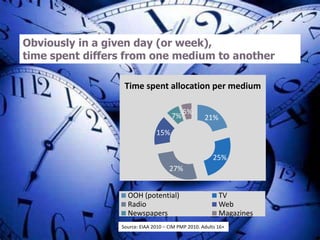
- 2. Obviously in a given day (or week), time spent differs from one medium to another 21% 25% 27% 15% 7% 5% Time spent allocation per medium OOH (potential) TV Radio Web Newspapers Magazines Source: EIAA 2010 â CIM PMP 2010. Adults 16+
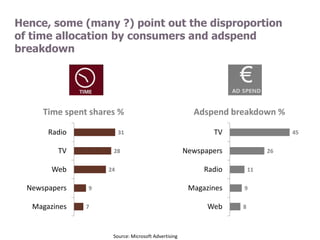
- 3. Hence, some (many ?) point out the disproportion of time allocation by consumers and adspend breakdown 8 9 11 26 45 Web Magazines Radio Newspapers TV Adspend breakdown % 7 9 24 28 31 Magazines Newspapers Web TV Radio Time spent shares % Source: Microsoft Advertising
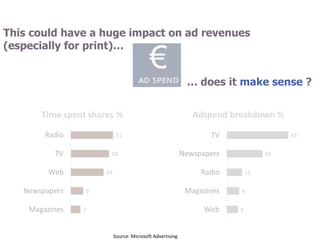
- 4. This could have a huge impact on ad revenues (especially for print)âĶ Source: Microsoft Advertising âĶ does it make sense ?
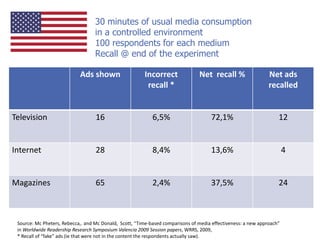
- 5. An American survey first analysed this: what is the advertising efficiency of exactly the same time allocated to 3 different media ? This is what we called the first ÂŦ 30 minutes survey Âŧ
- 6. Ads shown Incorrect recall * Net recall % Net ads recalled Television 16 6,5% 72,1% 12 Internet 28 8,4% 13,6% 4 Magazines 65 2,4% 37,5% 24 30 minutes of usual media consumption in a controlled environment 100 respondents for each medium Recall @ end of the experiment Source: Mc Pheters, Rebecca,. and Mc Donald, Scott, âTime-based comparisons of media effectiveness: a new approachâ in Worldwide Readership Research Symposium Valencia 2009 Session papers, WRRS, 2009, * Recall of âfakeâ ads (ie that were not in the content the respondents actually saw).
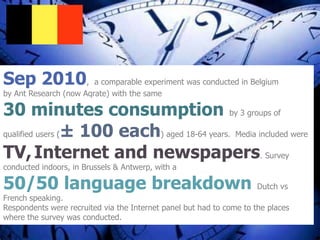
- 7. Sep 2010, a comparable experiment was conducted in Belgium by Ant Research (now Aqrate) with the same 30 minutes consumption by 3 groups of qualified users (Âą 100 each) aged 18-64 years. Media included were TV,Internet and newspapers. Survey conducted indoors, in Brussels & Antwerp, with a 50/50 language breakdown Dutch vs French speaking. Respondents were recruited via the Internet panel but had to come to the places where the survey was conducted.
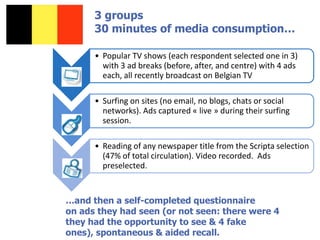
- 8. 3 groups 30 minutes of media consumptionâĶ âĒ Popular TV shows (each respondent selected one in 3) with 3 ad breaks (before, after, and centre) with 4 ads each, all recently broadcast on Belgian TV âĒ Surfing on sites (no email, no blogs, chats or social networks). Ads captured ÂŦ live Âŧ during their surfing session. âĒ Reading of any newspaper title from the Scripta selection (47% of total circulation). Video recorded. Ads preselected. âĶand then a self-completed questionnaire on ads they had seen (or not seen: there were 4 they had the opportunity to see & 4 fake ones), spontaneous & aided recall.
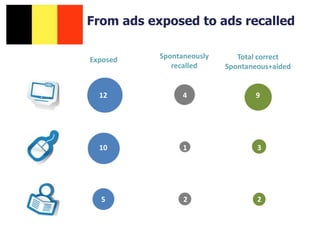
- 9. Exposed Spontaneously recalled Total correct Spontaneous+aided From ads exposed to ads recalled 5 2 2 10 1 3 12 4 9
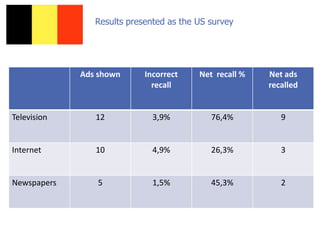
- 10. Ads shown Incorrect recall Net recall % Net ads recalled Television 12 3,9% 76,4% 9 Internet 10 4,9% 26,3% 3 Newspapers 5 1,5% 45,3% 2 Results presented as the US survey
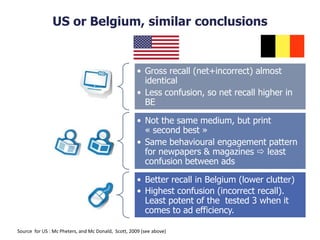
- 11. US or Belgium, similar conclusions TV âĒ Gross recall (net+incorrect) almost identical âĒ Less confusion, so net recall higher in BE Newsp- Magazines âĒ Not the same medium, but print ÂŦ second best Âŧ âĒ Same behavioural engagement pattern for newpapers & magazines ï° least confusion between ads Web âĒ Better recall in Belgium (lower clutter) âĒ Highest confusion (incorrect recall). Least potent of the tested 3 when it comes to ad efficiency. Source for US : Mc Pheters, and Mc Donald, Scott, 2009 (see above)
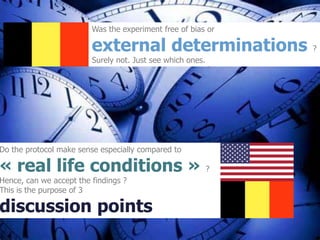
- 12. Was the experiment free of bias or external determinations ? Surely not. Just see which ones. Do the protocol make sense especially compared to ÂŦ real life conditions Âŧ ? Hence, can we accept the findings ? This is the purpose of 3 discussion points
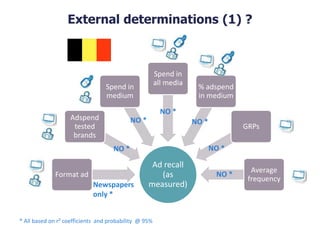
- 13. Ad recall (as measured) Format ad Adspend tested brands Spend in medium Spend in all media % adspend in medium GRPs Average frequency Newspapers only * NO * NO * NO * NO * NO * NO * External determinations (1) ? * All based on rÂē coefficients and probability @ 95%
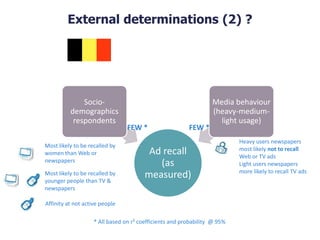
- 14. Ad recall (as measured) Socio- demographics respondents Media behaviour (heavy-medium- light usage) FEW * FEW * External determinations (2) ? * All based on rÂē coefficients and probability @ 95% Most likely to be recalled by women than Web or newspapers Most likely to be recalled by younger people than TV & newspapers Affinity at not active people Heavy users newspapers most likely not to recall Web or TV ads Light users newspapers more likely to recall TV ads
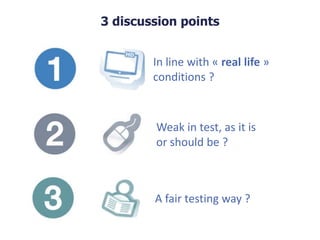
- 15. 3 discussion points In line with ÂŦ real life Âŧ conditions ? Weak in test, as it is or should be ? A fair testing way ?
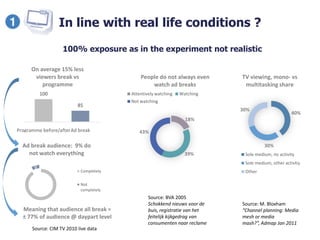
- 16. In line with real life conditions ? 18% 39% 43% People do not always even watch ad breaks Attentively watching Watching Not watching 100 85 Programme before/afterAd break On average 15% less viewers break vs programme Source: CIM TV 2010 live data 9 Ad break audience: 9% do not watch everything Completely Not completely Source: BVA 2005 Schokkend nieuws voor de buis, registratie van het feitelijk kijkgedrag van consumenten naar reclame 40% 30% 30% TV viewing, mono- vs multitasking share Sole medium, no activity Sole medium, other activtiy Other Source: M. Bloxham âChannel planning: Media mesh or media mash?â, Admap Jan 2011 Meaning that audience all break = Âą 77% of audience @ daypart level 100% exposure as in the experiment not realistic
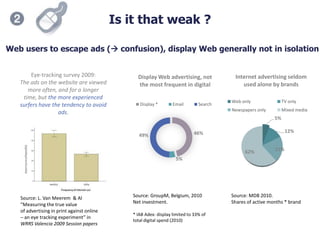
- 17. Is it that weak ? Eye-tracking survey 2009: The ads on the website are viewed more often, and for a longer time, but the more experienced surfers have the tendency to avoid ads. Source: L. Van Meerem & Al âMeasuring the true value of advertising in print against online â an eye tracking experimentâ in WRRS Valencia 2009 Session papers 46% 5% 49% Display Web advertising, not the most frequent in digital Display * Email Search Source: GroupM, Belgium, 2010 Net investment. * IAB Adex: display limited to 33% of total digital spend (2010) 5% 12% 21%62% Internet advertising seldom used alone by brands Web only TV only Newspapers only Mixed media Source: MDB 2010. Shares of active months * brand Web users to escape ads (ï confusion), display Web generally not in isolation
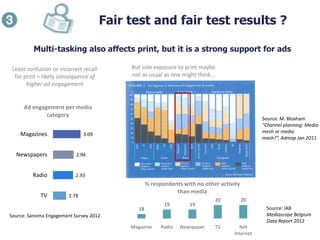
- 18. Fair test and fair test results ? 2.78 2.93 2.94 3.09 TV Radio Newspapers Magazines Ad engagement per media category Least confusion or incorrect recall for print = likely consequence of higher ad engagement Source: Sanoma Engagement Survey 2012 But sole exposure to print maybe not as usual as one might thinkâĶ 18 19 19 20 20 Magazine Radio Newspaper TV Net Internet % respondents with no other activity than media Source: IAB Mediascope Belgium Data Report 2012 Source: M. Bloxham âChannel planning: Media mesh or media mash?â, Admap Jan 2011 Multi-tasking also affects print, but it is a strong support for ads
- 19. Few external determinations: results may be considered ÂŦ pure enough Âŧ But it is definitely a ÂŦ lab experiment Âŧ: real life conditions are not fully comparable Nevertheless: time wonât tell anything. The art for media is to create opportunities (time may helpâĶ) but above all to transform these opportunities into persuasive consumer experiences Hence, time devoted to media is not and will never be a robust base for ad budget allocations.
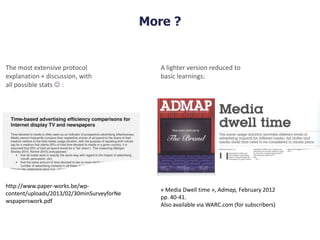
- 20. More ? http://www.paper-works.be/wp- content/uploads/2013/02/30minSurveyforNe wspaperswork.pdf The most extensive protocol explanation + discussion, with all possible stats ï : ÂŦ Media Dwell time Âŧ, Admap, February 2012 pp. 40-41. Also available via WARC.com (for subscribers) A lighter version reduced to basic learnings:


