5 random variables
âĒDownload as PPTX, PDFâĒ
8 likesâĒ5,927 views

The document discusses random variables and probability distributions. It provides examples of random variables like the number of heads from tossing a coin 3 times. The possible values and probabilities are shown in tables and graphs. Key concepts explained include the expected value (mean) of a random variable being the sum of each value multiplied by its probability. The variance is the sum of the squared differences between each value and the mean, and measures variability. The standard deviation is the square root of the variance.

5 random variables
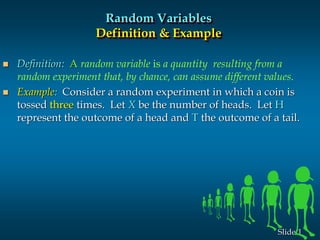
- 1. 1šÝšÝßĢ Random Variables Definition & Example ïŪ Definition: A random variable is a quantity resulting from a random experiment that, by chance, can assume different values. ïŪ Example: Consider a random experiment in which a coin is tossed three times. Let X be the number of heads. Let H represent the outcome of a head and T the outcome of a tail.
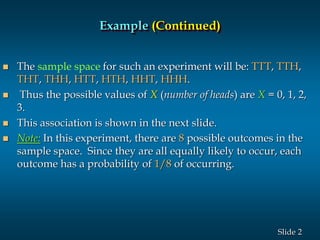
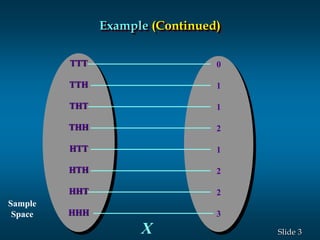
- 2. 2šÝšÝßĢ ïŪ The sample space for such an experiment will be: TTT, TTH, THT, THH, HTT, HTH, HHT, HHH. ïŪ Thus the possible values of X (number of heads) are X = 0, 1, 2, 3. ïŪ This association is shown in the next slide. ïŪ Note: In this experiment, there are 8 possible outcomes in the sample space. Since they are all equally likely to occur, each outcome has a probability of 1/8 of occurring. Example (Continued)
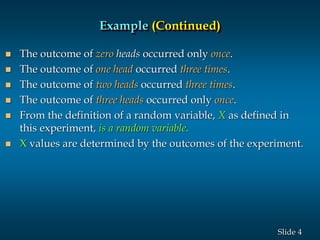
- 4. 4šÝšÝßĢ ïŪ The outcome of zero heads occurred only once. ïŪ The outcome of one head occurred three times. ïŪ The outcome of two heads occurred three times. ïŪ The outcome of three heads occurred only once. ïŪ From the definition of a random variable, X as defined in this experiment, is a random variable. ïŪ X values are determined by the outcomes of the experiment. Example (Continued)
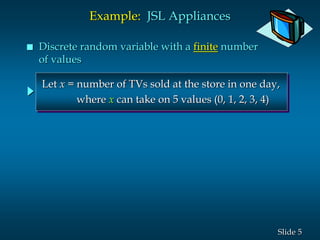
- 5. 5šÝšÝßĢ Let x = number of TVs sold at the store in one day, where x can take on 5 values (0, 1, 2, 3, 4) Example: JSL Appliances ïŪ Discrete random variable with a finite number of values
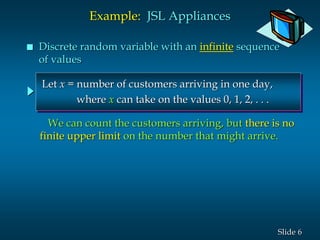
- 6. 6šÝšÝßĢ Let x = number of customers arriving in one day, where x can take on the values 0, 1, 2, . . . Example: JSL Appliances ïŪ Discrete random variable with an infinite sequence of values We can count the customers arriving, but there is no finite upper limit on the number that might arrive.
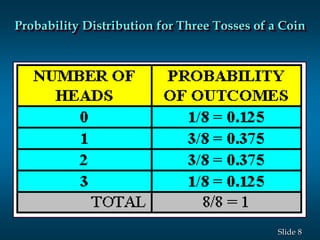
- 7. 7šÝšÝßĢ Probability Distribution: Definition ïŪ Definition: A probability distribution is a listing of all the outcomes of an experiment and their associated probabilities. ïŪ The probability distribution for the random variable X (number of heads) in tossing a coin three times is shown next.
- 8. 8šÝšÝßĢ Probability Distribution for Three Tosses of a Coin
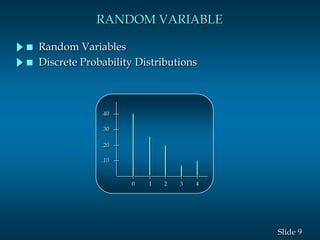
- 9. 9šÝšÝßĢ RANDOM VARIABLE .10 .20 .30 .40 0 1 2 3 4 ïŪ Random Variables ïŪ Discrete Probability Distributions
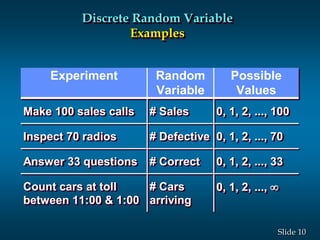
- 10. 10šÝšÝßĢ Discrete Random Variable Examples Experiment Random Variable Possible Values Make 100 sales calls # Sales 0, 1, 2, ..., 100 Inspect 70 radios # Defective 0, 1, 2, ..., 70 Answer 33 questions # Correct 0, 1, 2, ..., 33 Count cars at toll between 11:00 & 1:00 # Cars arriving 0, 1, 2, ..., ïĨ
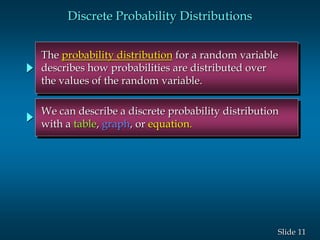
- 11. 11šÝšÝßĢ The probability distribution for a random variable describes how probabilities are distributed over the values of the random variable. We can describe a discrete probability distribution with a table, graph, or equation. Discrete Probability Distributions
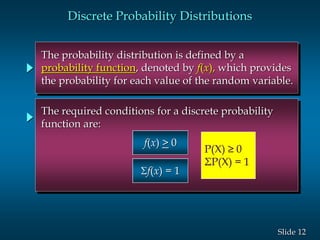
- 12. 12šÝšÝßĢ The probability distribution is defined by a probability function, denoted by f(x), which provides the probability for each value of the random variable. The required conditions for a discrete probability function are: Discrete Probability Distributions f(x) > 0 ïf(x) = 1 P(X) âĨ 0 ÎĢP(X) = 1
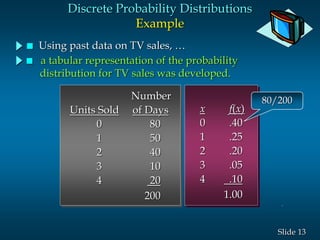
- 13. 13šÝšÝßĢ ïŪ a tabular representation of the probability distribution for TV sales was developed. ïŪ Using past data on TV sales, âĶ Number Units Sold of Days 0 80 1 50 2 40 3 10 4 20 200 x f(x) 0 .40 1 .25 2 .20 3 .05 4 .10 1.00 80/200 Discrete Probability Distributions Example
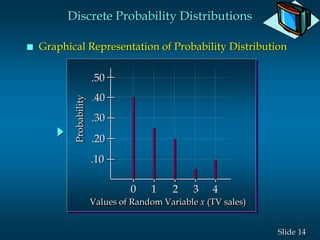
- 14. 14šÝšÝßĢ .10 .20 .30 .40 .50 0 1 2 3 4 Values of Random Variable x (TV sales) Probability Discrete Probability Distributions ïŪ Graphical Representation of Probability Distribution
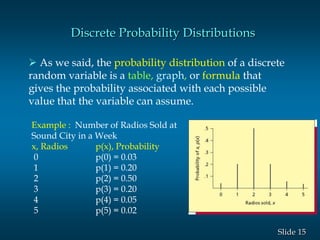
- 15. 15šÝšÝßĢ Discrete Probability Distributions ï As we said, the probability distribution of a discrete random variable is a table, graph, or formula that gives the probability associated with each possible value that the variable can assume. Example : Number of Radios Sold at Sound City in a Week x, Radios p(x), Probability 0 p(0) = 0.03 1 p(1) = 0.20 2 p(2) = 0.50 3 p(3) = 0.20 4 p(4) = 0.05 5 p(5) = 0.02
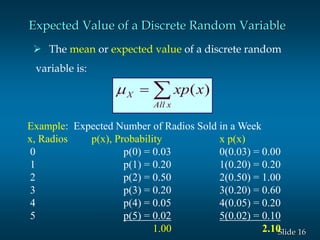
- 16. 16šÝšÝßĢ Expected Value of a Discrete Random Variable ï The mean or expected value of a discrete random variable is: ïĨï― xAll X xxp )(ï Example: Expected Number of Radios Sold in a Week x, Radios p(x), Probability x p(x) 0 p(0) = 0.03 0(0.03) = 0.00 1 p(1) = 0.20 1(0.20) = 0.20 2 p(2) = 0.50 2(0.50) = 1.00 3 p(3) = 0.20 3(0.20) = 0.60 4 p(4) = 0.05 4(0.05) = 0.20 5 p(5) = 0.02 5(0.02) = 0.10 1.00 2.10
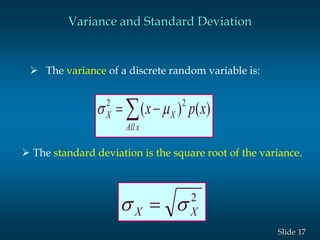
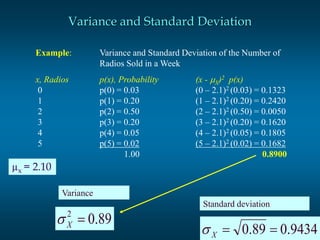
- 17. 17šÝšÝßĢ Variance and Standard Deviation ï The variance of a discrete random variable is: ïĨ ïï― xAll XX xpx )()( 22 ïïģ 2 XX ïģïģ ï― ï The standard deviation is the square root of the variance.
- 18. 18šÝšÝßĢ Example: Variance and Standard Deviation of the Number of Radios Sold in a Week x, Radios p(x), Probability (x - ïX)2 p(x) 0 p(0) = 0.03 (0 â 2.1)2 (0.03) = 0.1323 1 p(1) = 0.20 (1 â 2.1)2 (0.20) = 0.2420 2 p(2) = 0.50 (2 â 2.1)2 (0.50) = 0.0050 3 p(3) = 0.20 (3 â 2.1)2 (0.20) = 0.1620 4 p(4) = 0.05 (4 â 2.1)2 (0.05) = 0.1805 5 p(5) = 0.02 (5 â 2.1)2 (0.02) = 0.1682 1.00 0.8900 89.02 ï―Xïģ Variance 9434.089.0 ï―ï―Xïģ Standard deviation Variance and Standard Deviation Âĩx = 2.10
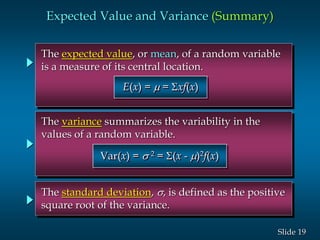
- 19. 19šÝšÝßĢ Expected Value and Variance (Summary) The expected value, or mean, of a random variable is a measure of its central location. The variance summarizes the variability in the values of a random variable. The standard deviation, ïģ, is defined as the positive square root of the variance. Var(x) = ïģ 2 = ï(x - ï)2f(x) E(x) = ï = ïxf(x)