Volatility by the numbers
•
0 likes•306 views

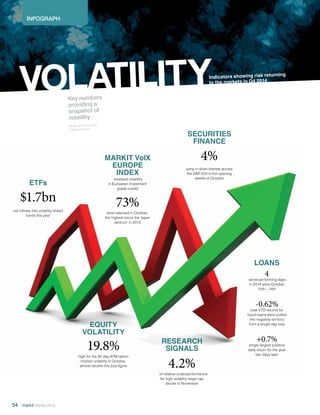
This infographic document provides a snapshot of volatility indicators across various asset classes in late 2014. Equity volatility reached a high of 19.8% in October, nearly double the level in July, signaling rising risk in financial markets in the fourth quarter. Short interest in the S&P 500 jumped 4% in early October. Loans had their worst four days of the year from October 10-14, with total year-to-date returns for liquid loans falling into negative territory due to a single-day loss, though a positive return two days later partially offset this.
Volatility by the numbers
- 1. INFOGRAPH VOLATILITY 54 Winter 2014 All data correct at time of going to press Key numbers providing a snapshot of volatility EQUITY VOLATILITY 19.8% high for the 90 day ATM option implied volatility in October, almost double the July figure Indicators showing risk returning to the markets in Q4 2014 SECURITIES FINANCE 4% jump in short interest across the S&P 500 in the opening weeks of October LOANS 4 worst performing days in 2014 were October 10th – 14th -0.62% total YTD returns for liquid loans were pulled into negative territory from a single day loss +0.7% single largest positive daily return for the year two days later RESEARCH SIGNALS 4.2% of relative underperformance for high volatility large cap stocks in November MARKIT VolX EUROPE INDEX (realised volatility in European investment grade credit) 73% level reached in October, the highest since the ‘taper tantrum’ in 2013 ETFs $1.7bn net inflows into volatility-linked funds this year