


8.-Planning--Analysis-and-evaluation.pptx
- 1. Paper 5: planning, analysis and evaluation
- 2. Lesson 1 : QUESTION 1
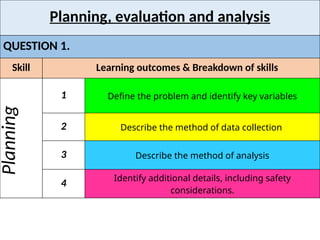
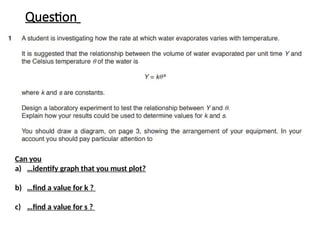
- 3. Planning, evaluation and analysis QUESTION 1. Skill Learning outcomes & Breakdown of skills Planning 1 Define the problem and identify key variables 2 Describe the method of data collection 3 Describe the method of analysis 4 Identify additional details, including safety considerations.
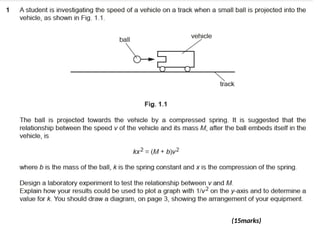
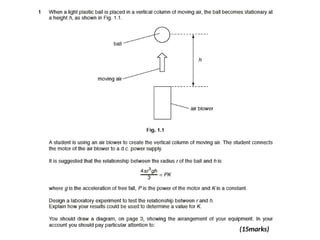
- 4. (15marks)
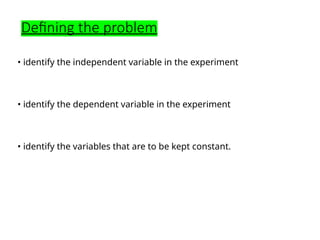
- 5. Defining the problem ŌĆó identify the independent variable in the experiment ŌĆó identify the dependent variable in the experiment ŌĆó identify the variables that are to be kept constant.
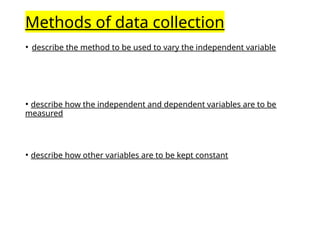
- 6. Methods of data collection ŌĆó describe the method to be used to vary the independent variable ŌĆó describe how the independent and dependent variables are to be measured ŌĆó describe how other variables are to be kept constant
- 7. Cont. ŌĆó describe, with the aid of a clear labelled diagram, the arrangement of apparatus for the experiment and the procedures to be followed.
- 8. Method of analysis ŌĆó describe how the data should be used in order to reach a conclusion, including details of derived quantities to be calculated from graphs.
- 9. Additional detail including safety considerations ŌĆó assess the risks of their experiment ŌĆó describe precautions that should be taken to keep risks to a minimum.
- 10. (15marks)
- 11. Defining the problem ŌĆó identify the independent variable in the experiment ŌĆó identify the dependent variable in the experiment ŌĆó identify the variables that are to be kept constant.
- 12. Methods of data collection ŌĆó describe the method to be used to vary the independent variable ŌĆó describe how the independent and dependent variables are to be measured ŌĆó describe how other variables are to be kept constant
- 13. Cont. ŌĆó describe, with the aid of a clear labelled diagram, the arrangement of apparatus for the experiment and the procedures to be followed.
- 14. Method of analysis ŌĆó describe how the data should be used in order to reach a conclusion, including details of derived quantities to be calculated from graphs.
- 15. Additional detail including safety considerations ŌĆó assess the risks of their experiment ŌĆó describe precautions that should be taken to keep risks to a minimum.
- 16. Lesson 2 : QUESTION 2
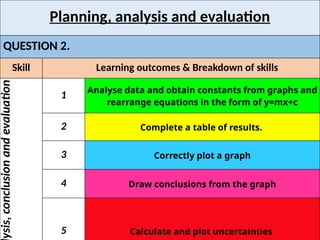
- 17. Planning, analysis and evaluation QUESTION 2. Skill Learning outcomes & Breakdown of skills ysis, conclusion and evaluation 1 Analyse data and obtain constants from graphs and rearrange equations in the form of y=mx+c 2 Complete a table of results. 3 Correctly plot a graph 4 Draw conclusions from the graph 5 Calculate and plot uncertainties
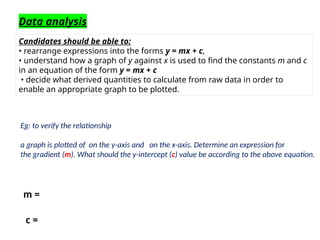
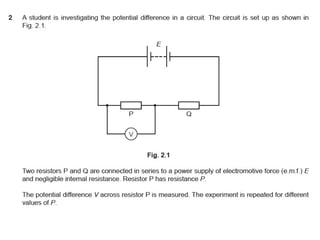
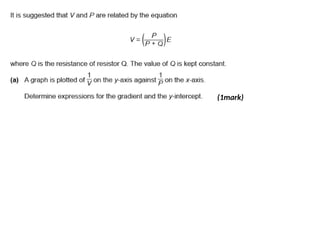
- 18. Data analysis Candidates should be able to: ŌĆó rearrange expressions into the forms y = mx + c, ŌĆó understand how a graph of y against x is used to find the constants m and c in an equation of the form y = mx + c ŌĆó decide what derived quantities to calculate from raw data in order to enable an appropriate graph to be plotted. Eg: to verify the relationship a graph is plotted of on the y-axis and on the x-axis. Determine an expression for the gradient (m). What should the y-intercept (c) value be according to the above equation. m = c =
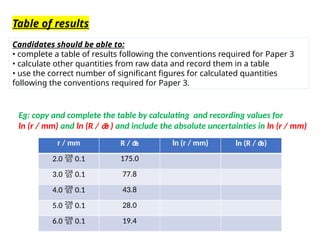
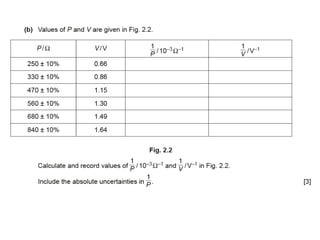
- 19. Table of results Candidates should be able to: ŌĆó complete a table of results following the conventions required for Paper 3 ŌĆó calculate other quantities from raw data and record them in a table ŌĆó use the correct number of significant figures for calculated quantities following the conventions required for Paper 3. r / mm R / ’üŚ ln (r / mm) ln (R / ’üŚ) 2.0 ’é▒ 0.1 175.0 3.0 ’é▒ 0.1 77.8 4.0 ’é▒ 0.1 43.8 5.0 ’é▒ 0.1 28.0 6.0 ’é▒ 0.1 19.4 Eg: copy and complete the table by calculating and recording values for ln (r / mm) and ln (R / ’üŚ ) and include the absolute uncertainties in ln (r / mm)
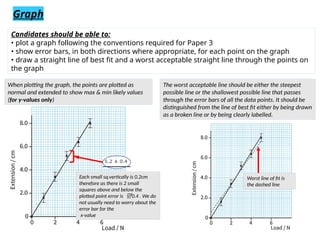
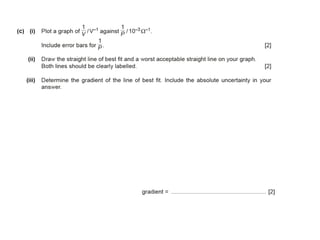
- 20. Graph The worst acceptable line should be either the steepest possible line or the shallowest possible line that passes through the error bars of all the data points. It should be distinguished from the line of best fit either by being drawn as a broken line or by being clearly labelled. When plotting the graph, the points are plotted as normal and extended to show max & min likely values (for y-values only) Each small sq.vertically is 0.2cm therefore as there is 2 small squares above and below the plotted point error is ’é▒0.4 . We do not usually need to worry about the error bar for the x-value Worst line of fit is the dashed line Candidates should be able to: ŌĆó plot a graph following the conventions required for Paper 3 ŌĆó show error bars, in both directions where appropriate, for each point on the graph ŌĆó draw a straight line of best fit and a worst acceptable straight line through the points on the graph
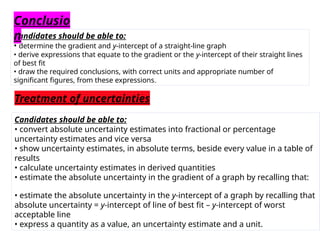
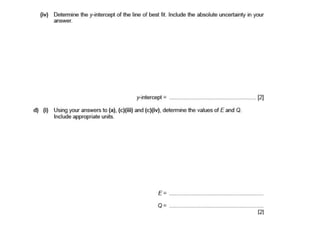
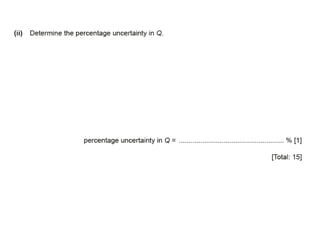
- 21. Candidates should be able to: ŌĆó determine the gradient and y-intercept of a straight-line graph ŌĆó derive expressions that equate to the gradient or the y-intercept of their straight lines of best fit ŌĆó draw the required conclusions, with correct units and appropriate number of significant figures, from these expressions. Conclusio n Treatment of uncertainties Candidates should be able to: ŌĆó convert absolute uncertainty estimates into fractional or percentage uncertainty estimates and vice versa ŌĆó show uncertainty estimates, in absolute terms, beside every value in a table of results ŌĆó calculate uncertainty estimates in derived quantities ŌĆó estimate the absolute uncertainty in the gradient of a graph by recalling that: ŌĆó estimate the absolute uncertainty in the y-intercept of a graph by recalling that absolute uncertainty = y-intercept of line of best fit ŌĆō y-intercept of worst acceptable line ŌĆó express a quantity as a value, an uncertainty estimate and a unit.
- 23. (1mark)
- 26. Graph
- 29. Lesson 3 : More complicated analysis of data
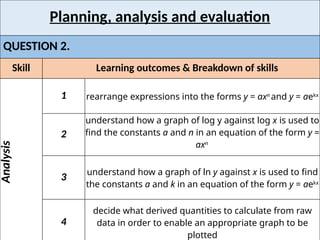
- 30. Planning, analysis and evaluation QUESTION 2. Skill Learning outcomes & Breakdown of skills Analysis 1 rearrange expressions into the forms y = axn and y = aekx 2 understand how a graph of log y against log x is used to find the constants a and n in an equation of the form y = axn 3 understand how a graph of ln y against x is used to find the constants a and k in an equation of the form y = aekx 4 decide what derived quantities to calculate from raw data in order to enable an appropriate graph to be plotted
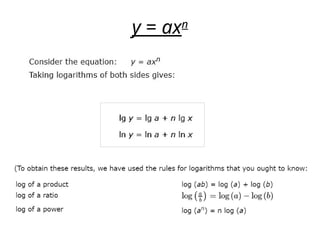
- 31. y = axn
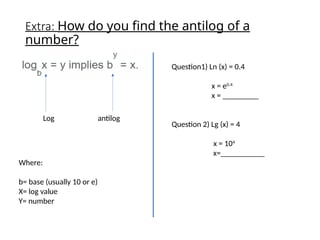
- 32. Extra: How do you find the antilog of a number? Log antilog Where: b= base (usually 10 or e) X= log value Y= number Question1) Ln (x) = 0.4 x = e0.4 x = _________ Question 2) Lg (x) = 4 x = 104 x=___________
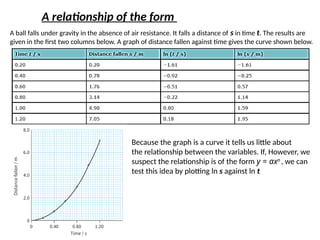
- 33. Because the graph is a curve it tells us little about the relationship between the variables. If, However, we suspect the relationship is of the form y = axn , we can test this idea by plotting ln s against ln t A ball falls under gravity in the absence of air resistance. It falls a distance of s in time t. The results are given in the first two columns below. A graph of distance fallen against time gives the curve shown below. A relationship of the form
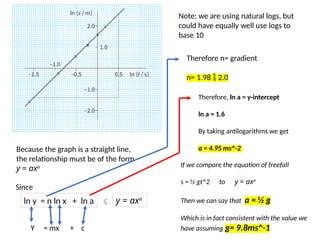
- 34. Note: we are using natural logs, but could have equally well use logs to base 10 Because the graph is a straight line, the relationship must be of the form y = axn y = axn Since Therefore n= gradient n= 1.98 ’é╗ 2.0 Y = mx + c ln y = n ln x + ln a ’āĀ Therefore, ln a = y-intercept ln a = 1.6 By taking antilogarithms we get a = 4.95 ms^-2 If we compare the equation of freefall s = ┬Į gt^2 to y = axn Then we can say that a = ┬Į g Which is in fact consistent with the value we have assuming g= 9.8ms^-1
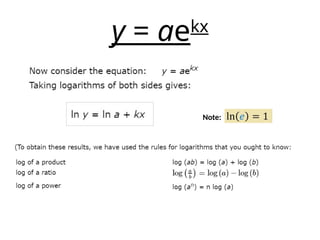
- 35. y = aekx Note:
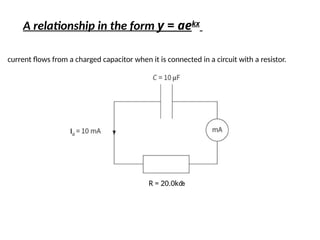
- 36. A relationship in the form y = aekx current flows from a charged capacitor when it is connected in a circuit with a resistor. Io R = 20.0k’üŚ
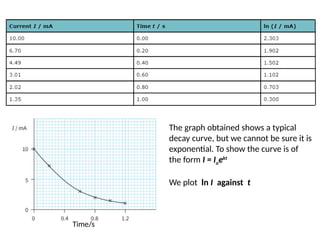
- 37. Time/s The graph obtained shows a typical decay curve, but we cannot be sure it is exponential. To show the curve is of the form I = Ioekt We plot ln I against t
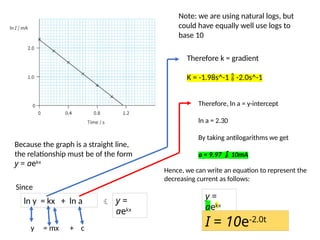
- 38. Note: we are using natural logs, but could have equally well use logs to base 10 Because the graph is a straight line, the relationship must be of the form y = aekx y = aekx Since Therefore k = gradient K = -1.98s^-1 ’é╗ -2.0s^-1 y = mx + c ln y = kx + ln a ’āĀ Therefore, ln a = y-intercept ln a = 2.30 By taking antilogarithms we get a = 9.97 ’é╗ 10mA Hence, we can write an equation to represent the decreasing current as follows: y = aekx I = 10e-2.0t
- 39. Question Can you a) ŌĆ”identify graph that you must plot? b) ŌĆ”find a value for k ? c) ŌĆ”find a value for s ?
Editor's Notes
- #1: Paper 5 is broken down into two parts. We are going to breakdown this paper and explore the individual skills needed for each question. In 3 separate lessons
- #2: In this lesson we will focus on how what skills and knowledge are needed to tackle Question 1.
- #4: This question is taken from. March 2017 (v2) QP - Paper 5 CIE Physics A-level Mark scheme link’āĀ https://www.physicsandmathstutor.com/pdf-pages/?pdf=https%3A%2F%2Fpmt.physicsandmathstutor.com%2Fdownload%2FPhysics%2FA-level%2FPast-Papers%2FCIE%2FPaper-5%2FMarch%25202017%2520(v2)%2520MS%2520-%2520Paper%25205%2520CIE%2520Physics%2520A-level.pdf
- #9: Candidates should also be able to: ŌĆó describe the use of an oscilloscope (or storage oscilloscope) to measure voltage, current, time and frequency ŌĆó describe how to use light gates connected to a data logger to determine time, velocity and acceleration ŌĆó describe how other sensors can be used with a data logger, e.g. motion sensor.
- #10: This question was taken from November 2019 (v1) QP - Paper 5 CIE Physics A-level MARK SCHEME: ’āĀ https://www.physicsandmathstutor.com/pdf-pages/?pdf=https%3A%2F%2Fpmt.physicsandmathstutor.com%2Fdownload%2FPhysics%2FA-level%2FPast-Papers%2FCIE%2FPaper-5%2FNovember%25202019%2520(v1)%2520MS%2520-%2520Paper%25205%2520CIE%2520Physics%2520A-level.pdf
- #15: Candidates should also be able to: ŌĆó describe the use of an oscilloscope (or storage oscilloscope) to measure voltage, current, time and frequency ŌĆó describe how to use light gates connected to a data logger to determine time, velocity and acceleration ŌĆó describe how other sensors can be used with a data logger, e.g. motion sensor.
- #19: Where logarithms are required, units should be shown with the quantity whose logarithm is being taken, e.g. ln (d / cm). The logarithm itself does not have a unit. Write the unit inside the brackets For logarithmic quantities, the number of decimal places should correspond to the number of significant figures. For example, if L / cm is 76.5 (3 sf), then lg (L / cm) should be either 1.884 (3 dp) or 1.8837 (4 dp).
- #22: This question is taken from March 2017 (v2) QP - Paper 5 CIE Physics A-level Mark scheme link ’āĀ https://www.physicsandmathstutor.com/pdf-pages/?pdf=https%3A%2F%2Fpmt.physicsandmathstutor.com%2Fdownload%2FPhysics%2FA-level%2FPast-Papers%2FCIE%2FPaper-5%2FMarch%25202017%2520(v2)%2520MS%2520-%2520Paper%25205%2520CIE%2520Physics%2520A-level.pdf
- #24: To find the absolute uncertainty in 1/P ŌĆ”. 1) first calculate 1/P ’āĀ ie. 1/250 = 4.0 2) Since there is 10% uncertainty in value of P therefore to find the absolute value, take 10% of the calculated value for 1/P.
- #32: Remember log is usually base 10 and ln is base e
- #39: This is a PPQ for question 1 (November 2018 (v2) QP - Paper 5 CIE Physics A-level) . no need for students to do the write up (unless for extension) Get students to focus on the graph etc.
- #40: P661-663