841 ch3 forecasting
ŌĆóDownload as PPT, PDFŌĆó
1 likeŌĆó557 views

Forecasting is essential for capital budgeting and involves analyzing past data to establish future expectations. Quantitative forecasting uses statistical techniques like regression analysis to model relationships between variables in historical data and project them into the future. Qualitative forecasting relies more on expert judgment through techniques like the Delphi method. The document provides examples of quantitative forecasting using simple, multiple, and time series regression analysis in Excel to model sales data and generate sales forecasts.


841 ch3 forecasting
- 1. Ch 3: Forecasting: Techniques and Routes Introduction Forecasting is the establishment of future expectations by the analysis of past data, or the formation of opinions. Forecasting is an essential element of capital budgeting. Capital budgeting requires the commitment of significant funds today in the hope of long term benefits. The role of forecasting is the estimation of these benefits. 1
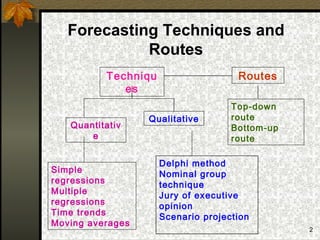
- 2. Forecasting Techniques and Routes Techniqu Routes es Top-down Qualitative route Quantitativ Bottom-up e route Delphi method Simple Nominal group regressions technique Multiple Jury of executive regressions opinion Time trends Scenario projection Moving averages 2
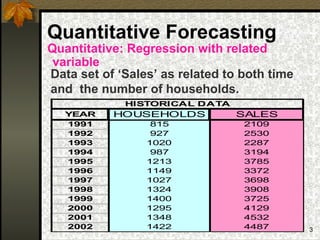
- 3. Quantitative Forecasting Quantitative: Regression with related variable Data set of ŌĆśSalesŌĆÖ as related to both time and the number of households. HISTORICAL DATA YEAR HOUSEHOLDS SALES 1991 815 2109 1992 927 2530 1993 1020 2287 1994 987 3194 1995 1213 3785 1996 1149 3372 1997 1027 3698 1998 1324 3908 1999 1400 3725 2000 1295 4129 2001 1348 4532 2002 1422 4487 3
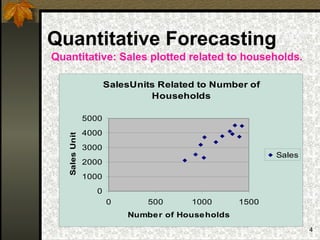
- 4. Quantitative Forecasting Quantitative: Sales plotted related to households. SalesUnits Related to Number of Households 5000 Sales Units 4000 3000 Sales 2000 1000 0 0 500 1000 1500 Numbe r of Households 4
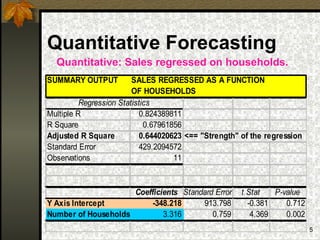
- 5. Quantitative Forecasting Quantitative: Sales regressed on households. SUMMARY OUTPUT SALES REGRESSED AS A FUNCTION Edited output OF HOUSEHOLDS from the Excel regression. Regression Statistics Multiple R 0.824389811 R Square 0.67961856 Adjusted R Square 0.644020623 <== "Strength" of the regression Standard Error 429.2094572 Observations 11 Coefficients Standard Error t Stat P-value Y Axis Intercept -348.218 913.798 -0.381 0.712 Number of Households 3.316 0.759 4.369 0.002 5
- 6. Quantitative Forecasting Quantitative: Sales regressed on households. Predicting with the regression output. Regression equation is: Sales(for year) = -348.218 + ( 3.316 x households). Assuming that a separate data set forecasts the number of households at 1795 for the year 2006, then: Sales(year 2006) = -348.218 + ( 3.316 x 1795) = 5,604 units. 6
- 7. Quantitative Forecasting Quantitative: Multiple Regression Sales as a function of both time and the number of households. HISTORICAL DATA YEAR HOUSEHOLDS SALES 1991 815 2109 1992 927 2530 1993 1020 2287 1994 987 3194 1995 1213 3785 1996 1149 3372 1997 1027 3698 1998 1324 3908 1999 1400 3725 2000 1295 4129 2001 1348 4532 2002 1422 4487 7
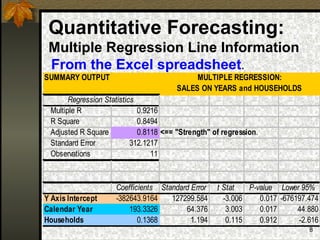
- 8. Quantitative Forecasting: Multiple Regression Line Information From the Excel spreadsheet. SUMMARY OUTPUT MULTIPLE REGRESSION: SALES ON YEARS and HOUSEHOLDS Regression Statistics Multiple R 0.9216 R Square 0.8494 Adjusted R Square 0.8118 <== "Strength" of regression. Standard Error 312.1217 Observations 11 Coefficients Standard Error t Stat P-value Lower 95% Y Axis Intercept -382643.9164 127299.584 -3.006 0.017 -676197.474 Calendar Year 193.3326 64.376 3.003 0.017 44.880 Households 0.1368 1.194 0.115 0.912 -2.616 8
- 9. Quantitative Forecasting: Using Multiple Regression Multiple regression equation is: Sales in year = -382643.91 +(193.33 x Year) + (0.1368 x Households) sales for the year 2005 is: Forecast of Sales in year 2005 = -382643.91 + (193.33 x 2005) + (0.1368 x 1586) = 5200 Units (Note: the sales forecast relies upon a separate forecast of the number of households, given as 1 586, for 2005.) 9
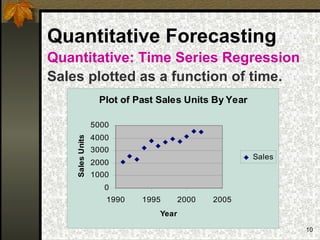
- 10. Quantitative Forecasting Quantitative: Time Series Regression Sales plotted as a function of time. Plot of Past Sales Units By Year 5000 4000 Sales Units 3000 Sales 2000 1000 0 1990 1995 2000 2005 Year 10
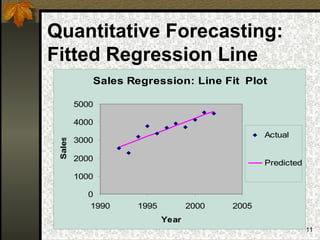
- 11. Quantitative Forecasting: Fitted Regression Line Sales Regression: Line Fit Plot 5000 4000 Actual 3000 Sales 2000 Predicted 1000 0 1990 1995 2000 2005 Year 11
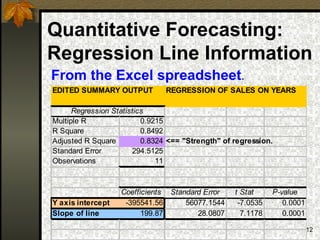
- 12. Quantitative Forecasting: Regression Line Information From the Excel spreadsheet. EDITED SUMMARY OUTPUT REGRESSION OF SALES ON YEARS Regression Statistics Multiple R 0.9215 R Square 0.8492 Adjusted R Square 0.8324 <== "Strength" of regression. Standard Error 294.5125 Observations 11 Coefficients Standard Error t Stat P-value Y axis intercept -395541.56 56077.1544 -7.0535 0.0001 Slope of line 199.87 28.0807 7.1178 0.0001 12
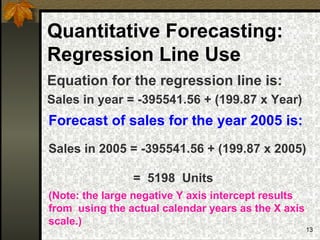
- 13. Quantitative Forecasting: Regression Line Use Equation for the regression line is: Sales in year = -395541.56 + (199.87 x Year) Forecast of sales for the year 2005 is: Sales in 2005 = -395541.56 + (199.87 x 2005) = 5198 Units (Note: the large negative Y axis intercept results from using the actual calendar years as the X axis scale.) 13
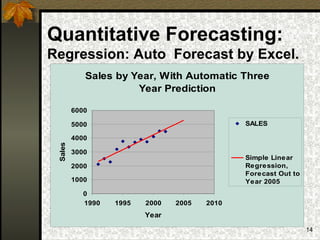
- 14. Quantitative Forecasting: Regression: Auto Forecast by Excel. Sales by Year, With Automatic Three Year Prediction 6000 5000 SALES 4000 Sales 3000 Simple Linear 2000 Regression, Forecast Out to 1000 Year 2005 0 1990 1995 2000 2005 2010 Year 14
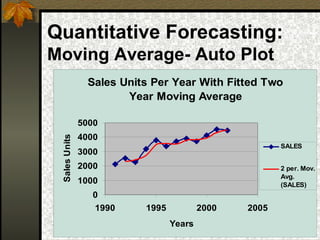
- 15. Quantitative Forecasting: Moving Average- Auto Plot Sales Units Per Year With Fitted Two Year Moving Average 5000 4000 Sales Units SALES 3000 2000 2 per. Mov. Avg. 1000 (SALES) 0 1990 1995 2000 2005 Years 15
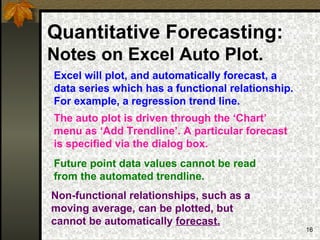
- 16. Quantitative Forecasting: Notes on Excel Auto Plot. Excel will plot, and automatically forecast, a data series which has a functional relationship. For example, a regression trend line. The auto plot is driven through the ŌĆśChartŌĆÖ menu as ŌĆśAdd TrendlineŌĆÖ. A particular forecast is specified via the dialog box. Future point data values cannot be read from the automated trendline. Non-functional relationships, such as a moving average, can be plotted, but cannot be automatically forecast. 16
- 17. Forecasting Routes Top-Down where international and national events affect the future behaviour of local variables. 17
- 18. Forecasting Routes Where local events affect the future behaviour of local variables. Bottom-Up 18
- 19. Forecasting: Summary ’ü« Sophisticated forecasting is essential for capital budgeting decisions ’ü« Quantitative forecasting uses historical data to establish relationships and trends which can be projected into the future ’ü« Qualitative forecasting uses experience and judgment to establish future behaviours ’ü« Forecasts can be made by either theŌĆśtop downŌĆÖ or ŌĆśbottom upŌĆÖ routes. Back to the Future! 19