際際滷

際際滷Share a Scribd company logo
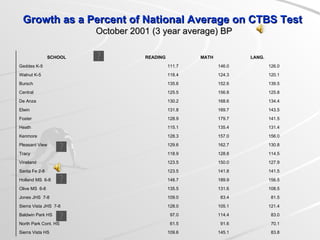
Growth as a Percent of National Average on CTBS Test   October 2001 (3 year average) BP 83.8 145.1 109.6 Sierra Vista HS 70.1 91.6 61.5 North Park Cont. HS 83.0 114.4 97.0 Baldwin Park HS 121.4 105.1 128.0 Sierra Vista JHS  7-8 81.5 83.4 109.0 Jones JHS  7-8 108.5 131.6 135.5 Olive MS  6-8 156.5 189.9 148.7 Holland MS  6-8 141.5 141.8 123.5 Santa Fe 2-8 127.9 150.0 123.5 Vineland 114.5 128.8 118.9 Tracy 130.8 162.7 129.6 Pleasant View 156.0 157.0 128.3 Kenmore 131.4 135.4 115.1 Heath 141.5 179.7 128.9 Foster 143.5 169.7 131.8 Elwin 134.4 168.6 130.2 De Anza 125.8 156.8 125.5 Central 139.5 152.6 135.6 Bursch 120.1 124.3 118.4 Walnut K-5 126.0 146.0 111.7 Geddes K-5 LANG. MATH READING SCHOOL
More Related Content

9. Value Added Assessment 2

  • 1. Growth as a Percent of National Average on CTBS Test October 2001 (3 year average) BP 83.8 145.1 109.6 Sierra Vista HS 70.1 91.6 61.5 North Park Cont. HS 83.0 114.4 97.0 Baldwin Park HS 121.4 105.1 128.0 Sierra Vista JHS 7-8 81.5 83.4 109.0 Jones JHS 7-8 108.5 131.6 135.5 Olive MS 6-8 156.5 189.9 148.7 Holland MS 6-8 141.5 141.8 123.5 Santa Fe 2-8 127.9 150.0 123.5 Vineland 114.5 128.8 118.9 Tracy 130.8 162.7 129.6 Pleasant View 156.0 157.0 128.3 Kenmore 131.4 135.4 115.1 Heath 141.5 179.7 128.9 Foster 143.5 169.7 131.8 Elwin 134.4 168.6 130.2 De Anza 125.8 156.8 125.5 Central 139.5 152.6 135.6 Bursch 120.1 124.3 118.4 Walnut K-5 126.0 146.0 111.7 Geddes K-5 LANG. MATH READING SCHOOL