Add Math(F5) Graph Of Function Ii 2.1
- 1. GRAPHS OF FUNCTIONS II MATHEMATICS Form 5 Chapter 2
- 2. ?
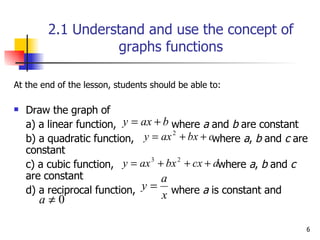
- 6. 2.1 Understand and use the concept of graphs functions At the end of the lesson, students should be able to: Draw the graph of a) a linear function, where a and b are constant b) a quadratic function, where a , b and c are constant c) a cubic function, where a , b and c are constant d) a reciprocal function, where a is constant and
- 7. Steps to draw a graph: Construct a table of values for a chosen range of x values. Draw the x-axis and the y-axis and use a suitable scale for each axis starting from the origin. Plot the x and y values as coordinate pairs on the Cartesian plane. Join the points to form a straight line (using ruler) or a smooth curve (without using ruler). Label the graph.
- 8. RECIPROCAL GRAPH General form: where a is a constant,
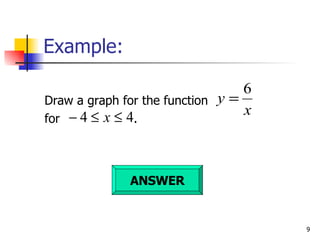
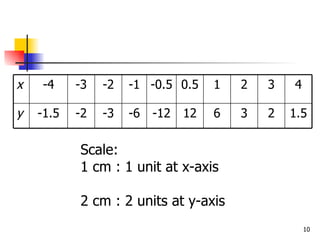
- 9. Example: Draw a graph for the function for . ANSWER
- 10. Scale: 1 cm : 1 unit at x-axis 2 cm : 2 units at y-axis 1.5 2 3 6 12 -12 -6 -3 -2 -1.5 y 4 3 2 1 0.5 -0.5 -1 -2 -3 -4 x
- 11. Characteristics of reciprocal graphs: Reciprocal graphs consist of TWO different parts. The shape of the graphs are known as HYPERBOLA.
- 12. WORKSHEET
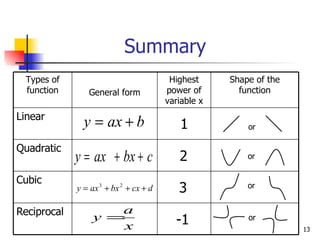
- 13. Summary or or or or 1 2 3 -1 Reciprocal Cubic Quadratic Linear Shape of the function Highest power of variable x General form Types of function

