


![[Template] 3.0 Relations and Functions. Intro Unit 4 ppt Student.pptx](https://cdn.slidesharecdn.com/ss_thumbnails/template3-241209144810-22b6602e-thumbnail.jpg?width=560&fit=bounds)


More Related Content
Similar to advance algebra PPT Chapter 2 algebra alg (20)
Recently uploaded (20)


advance algebra PPT Chapter 2 algebra alg
- 1. Lesson 1: Definition of Functions Prepared by: Hannaniah S. Jimanga
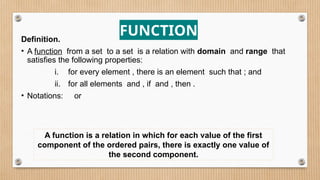
- 2. Definition. ŌĆó A function from a set to a set is a relation with domain and range that satisfies the following properties: i. for every element , there is an element such that ; and ii. for all elements and , if and , then . ŌĆó Notations: or FUNCTION A function is a relation in which for each value of the first component of the ordered pairs, there is exactly one value of the second component.
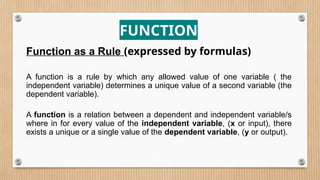
- 3. FUNCTION Function as a Rule (expressed by formulas) A function is a rule by which any allowed value of one variable ( the independent variable) determines a unique value of a second variable (the dependent variable). A function is a relation between a dependent and independent variable/s where in for every value of the independent variable, (x or input), there exists a unique or a single value of the dependent variable, (y or output).
- 4. FUNCTION Example. Function as Set of Ordered Pairs The rule for obtaining the unique value of the dependent variable A from the value of the dependent variable r.
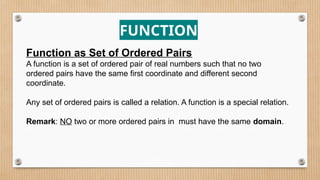
- 5. FUNCTION Function as Set of Ordered Pairs A function is a set of ordered pair of real numbers such that no two ordered pairs have the same first coordinate and different second coordinate. Any set of ordered pairs is called a relation. A function is a special relation. Remark: NO two or more ordered pairs in must have the same domain.
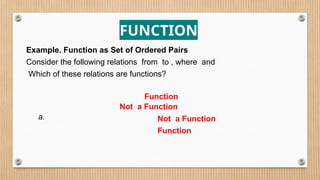
- 6. FUNCTION Example. Function as Set of Ordered Pairs Consider the following relations from to , where and Which of these relations are functions? a. Function Not a Function Not a Function Function
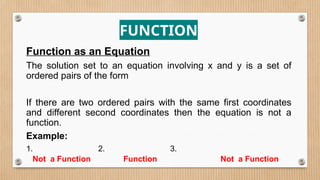
- 7. FUNCTION Function as an Equation The solution set to an equation involving x and y is a set of ordered pairs of the form If there are two ordered pairs with the same first coordinates and different second coordinates then the equation is not a function. Example: 1. 2. 3. Not a Function Function Not a Function
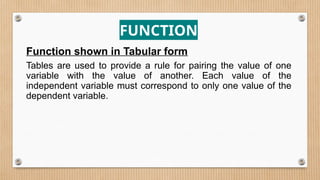
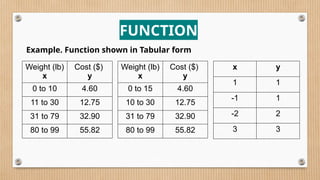
- 8. FUNCTION Function shown in Tabular form Tables are used to provide a rule for pairing the value of one variable with the value of another. Each value of the independent variable must correspond to only one value of the dependent variable.
- 9. FUNCTION Example. Function shown in Tabular form Weight (lb) x Cost ($) y 0 to 10 4.60 11 to 30 12.75 31 to 79 32.90 80 to 99 55.82 Weight (lb) x Cost ($) y 0 to 15 4.60 10 to 30 12.75 31 to 79 32.90 80 to 99 55.82 x y 1 1 -1 1 -2 2 3 3
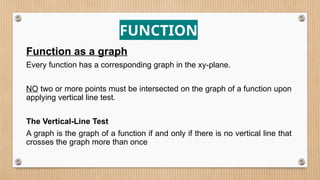
- 10. FUNCTION Function as a graph Every function has a corresponding graph in the xy-plane. NO two or more points must be intersected on the graph of a function upon applying vertical line test. The Vertical-Line Test A graph is the graph of a function if and only if there is no vertical line that crosses the graph more than once
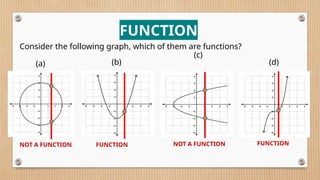
- 11. (a) (b) (c) (d) NOT A FUNCTION FUNCTION NOT A FUNCTION FUNCTION FUNCTION Consider the following graph, which of them are functions?
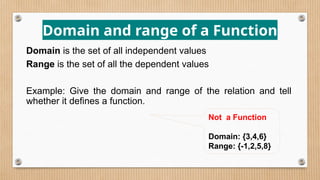
- 12. Domain and range of a Function Domain is the set of all independent values Range is the set of all the dependent values Example: Give the domain and range of the relation and tell whether it defines a function. Not a Function Domain: {3,4,6} Range: {-1,2,5,8}
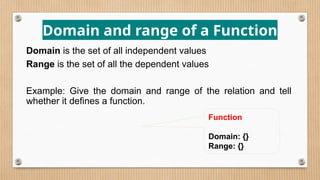
- 13. Domain and range of a Function Domain is the set of all independent values Range is the set of all the dependent values Example: Give the domain and range of the relation and tell whether it defines a function. Function Domain: {} Range: {}
- 14. Domain and range of a Function Domain is the set of all independent values Range is the set of all the dependent values Example: Give the domain and range of the relation and tell whether it defines a function. Not a Function Domain: {} Range: {}
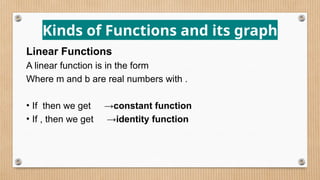
- 15. Kinds of Functions and its graph Linear Functions A linear function is in the form Where m and b are real numbers with . ŌĆó If then we get ŌåÆconstant function ŌĆó If , then we get ŌåÆidentity function
- 16. Kinds of Functions and its graph Linear Functions Example: Graph the following and state the domain and range.
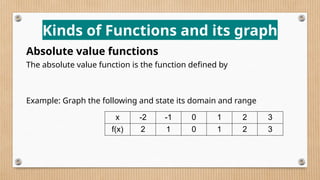
- 17. Kinds of Functions and its graph Absolute value functions The absolute value function is the function defined by Example: Graph the following and state its domain and range x -2 -1 0 1 2 3 f(x) 2 1 0 1 2 3
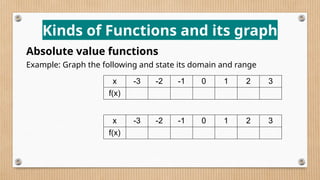
- 18. Kinds of Functions and its graph Absolute value functions Example: Graph the following and state its domain and range x -3 -2 -1 0 1 2 3 f(x) x -3 -2 -1 0 1 2 3 f(x)
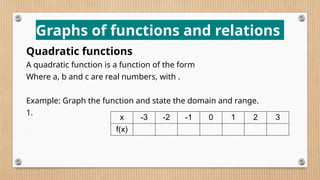
- 19. Graphs of functions and relations Quadratic functions A quadratic function is a function of the form Where a, b and c are real numbers, with . Example: Graph the function and state the domain and range. 1. x -3 -2 -1 0 1 2 3 f(x)
- 20. Graphs of functions and relations Quadratic functions Example: Graph the function and state the domain and range.
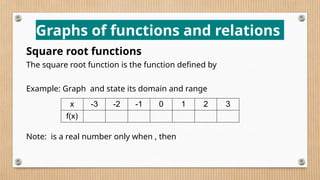
- 21. Graphs of functions and relations Square root functions The square root function is the function defined by Example: Graph and state its domain and range Note: is a real number only when , then x -3 -2 -1 0 1 2 3 f(x)
- 22. Graphs of functions and relations Square root functions Example: Graph the function and state the domain and range.
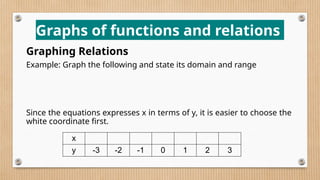
- 23. Graphs of functions and relations Graphing Relations Example: Graph the following and state its domain and range Since the equations expresses x in terms of y, it is easier to choose the white coordinate first. x y -3 -2 -1 0 1 2 3
- 24. Graphs of functions and relations Graphing Relations Example: Graph the following and state its domain and range
Editor's Notes
- #3: Page 198
- #4: Recall what relation is implying.
- #5: Examples formula
- #6: Recall what relation is implying.
- #8: Not a function () Function Not a function (2,2) &(2,-2)
- #9: Recall what relation is implying.
- #10: Function Not function function
- #11: Recall what relation is implying.
- #16: Recall what relation is implying.
- #17: Domain: (, range:{ Domain: (, range: (
- #18: Domain: all real numbers Range:
- #19: Domain: all real numbers Range:
- #20: Domain: ( Range: (
- #21: Domain: ( Range: (
- #22: is the inverse of so if we will graph square root functions we only take the positive side of the parabola. In the roots are
- #23: Domain: [) Range: [
- #24: domain: [, range: domain: [, range:
- #25: domain: [, range: domain: [, range: