際際滷

際際滷Share a Scribd company logo
PRESENTED BY :
                  Swapnil Turakane
                  Deepanjali Ahire
                  Akshaya Lad
                  Nikita Rane
                  Gaurav Tarkar.
UNION BANK OF    ALLAHABAD
                            ANDHRA BANK             INDIA           BANK

                    Performance for FY10 (In MILLIONS)

Total Business                   1,338,397.80     2,893,547.40 1,776,606.30

Total Assets                       903,804.70     1,951,618.40 1,216,992.10

Total Income                        73,374.90       152,774.20     98,851.00

Net Profit / Loss                   10,496.70        20,749.20     12,060.00

No. of Branches                         1,549            2,832        2,231
Andhra Bank          Union Bank of India          Allahabad Bank
                               Mar '10               Mar '10                      Mar '10
Income                                                           IN CR
Interest Earned                             6,372.87                    13,302.68                8,369.20
Other Income                                  964.62                     1,974.74                1,515.90
Total Income                                7,337.49                    15,277.42                9,885.10

Expenditure:
Interest expended                           4,178.13                    9,110.27                 5,718.72
Employee Cost                                 824.08                    1,354.99                 1,011.38

Selling and Admin Expenses                    574.14                    1,225.57                 1,175.48
Miscellaneous Expenses                        613.29                    1,351.53                   710.50

Preoperative Exp Capitalised                      0                            0                       0
Operating
Expenses                                    1,654.75                    3,206.76                 2,448.05
Provisions &
Contingencies                                 458.76                      885.47                   512.01
Total Expenses                              6,189.64                   13,042.36                 8,616.08

PBDIT                                       1,147.85                    2,235.06                 1,269.02
Intrest                                         0.00                        0.00                     0.00
PBDT                                        1,147.85                    2,235.06                 1,269.02
Depreciation                                     102                      160.14                     62.7
Net Profit for the Year                     1,045.85                    2,074.92                 1,206.32
Andhra Bank      Union Bank of India      Allahabad Bank

Extraordinary Items                           0                        0                   0
Profit brought forward                   152.94                     0.83               96.09
Total                                  1,198.79                     0.83               96.09
Preference Dividend
Equity Dividend                           242.5                   277.81              245.69
Corporate Dividend Tax                    40.28                    47.21               41.75
Per share data (annualised)
Earning Per Share (Rs)                    21.56                    41.08               27.01
Equity Dividend (%)                          50                       55                  55
Book Value (Rs)                           90.93                   174.37              131.73
Appropriations

Transfer to Statutory Reserves           415.36                 1,177.09              339.78

Transfer to Other Reserves                 300                    572.01                550

Proposed Dividend/Transfer to
Govt                                     282.78                   325.02              287.44

Balance c/f to Balance Sheet             200.66                     1.63               125.2
Total                                  1,198.80                 2,075.75            1,302.42
Union Bank of
                                                 Andhra Bank                      Allahabad Bank
                                                                        India
                                                                       IN CR

                                                  2011      2010      2011      2010    2011     2010


Net Profit Before Tax                           1767.07   1435.85        0         0       0        0


Net Cash From Operating Activities             -1251.29     5520 4431.48 -505.07       584.13   1523.1

Net Cash (used in)/from

Investing Activities                             -68.42   -121.81 -185.14 -200.43      -96.34   -71.22


Net Cash (used in)/from Financing Activities     611.01    481.96    75.41     497.26 1371.36 1079.58

Net (decrease)/increase In Cash and Cash
Equivalents                                      -708.7   5880.15 4321.75 -208.24 1859.15 2531.46


Opening Cash & Cash Equivalents                11167.66    5287.5 15776.69 15984.93 9168.23 6636.76


Closing Cash & Cash Equivalents                10458.96 11167.65 20098.44 15776.69 11027.38 9168.22
Mar '10              Mar '10              Mar '10
Proprietary ratio                    0.022265             0.020148             0.023808


Debt Equity ratio                    172.2488             354.8762             249.5886

Quick ratio                          0.768869             0.721239             0.684233

Operating Expenses
ratio                                25.96554             24.10612              29.2507

Expenses ratio:
Selling & admn exps
ratio                                0.090091              0.09213             0.140453

Net Profit ratio                     16.41097             15.59776              14.4138

Return on Investment
(ROI)                                19.61319             24.25377             23.34697

Divident per share                   5.830515             6.434765             6.434744

Return on Equity Capital             165.6392             355.7788             215.0504
Afs banking

More Related Content

What's hot (20)

PDF
Results Tracker 16.07.2012,
Mansukh Investment & Trading Solutions
DOC
Competitor analysis
Tanvi Sodhi
PDF
Nordnet Q2 2010 report
Nordnet
PDF
Nordnet Q3 2011 report
Nordnet
PDF
Nordnet Q2 2011 report
Nordnet
PDF
MBL Infrastructure IPO
Kunal
PPTX
Maruti balance sheet analysis
Pranab Sarkar
DOCX
Surya roshini blncsheet
naughtiegirl
XLSX
Supporting documents for financial report analysis
Sayen Upreti
PDF
Saral Gyan 15% @ 90 Days - Nov'12
SaralGyanTeam
PDF
Nirma Limited Working Capital Management
vnitritesh
PDF
alltel 4Q 06_Supplement
finance27
PPTX
BU121 StudentToGo New Venture
phileverson
PDF
coventry health care annual reports 2004
finance27
PDF
alltel 3Q05_Supplemental
finance27
PPTX
MRC case
Dan Saguy
XLS
Chapter 8 prob solutions
Manoj Girigoswami
PDF
morgan stanley Annual Reports 2001
finance2
DOCX
Mercury athletic footwear
antonesc
PDF
financial statement analysis of Idea Cellular
Deepak Srivastva
Results Tracker 16.07.2012,
Mansukh Investment & Trading Solutions
Competitor analysis
Tanvi Sodhi
Nordnet Q2 2010 report
Nordnet
Nordnet Q3 2011 report
Nordnet
Nordnet Q2 2011 report
Nordnet
MBL Infrastructure IPO
Kunal
Maruti balance sheet analysis
Pranab Sarkar
Surya roshini blncsheet
naughtiegirl
Supporting documents for financial report analysis
Sayen Upreti
Saral Gyan 15% @ 90 Days - Nov'12
SaralGyanTeam
Nirma Limited Working Capital Management
vnitritesh
alltel 4Q 06_Supplement
finance27
BU121 StudentToGo New Venture
phileverson
coventry health care annual reports 2004
finance27
alltel 3Q05_Supplemental
finance27
MRC case
Dan Saguy
Chapter 8 prob solutions
Manoj Girigoswami
morgan stanley Annual Reports 2001
finance2
Mercury athletic footwear
antonesc
financial statement analysis of Idea Cellular
Deepak Srivastva

Viewers also liked (17)

PPTX
Storyboard final p is for psycho
haastrud
PPT
Fierce resistance
stuszynski
PPTX
E book (murny, farhana, paraathi)
nurulmurny
PPTX
Movie trailer
haastrud
DOCX
Yr 8 h lesson food
Athena11
PPTX
Preservation of born digital commercial films
stuszynski
PPT
Amended
haastrud
PPT
Siirde muru
m8markus
PPTX
The historical background of sumpang bita
Muh Azwar
PPT
Siirdemuru
m8markus
PPTX
Battlefield
haastrud
PPTX
Dange In Natural
Muh Azwar
PPTX
Statement of intent
haastrud
PPT
Technology teaching college writing class
ProfBeckehimer
PPTX
Greek cities
Athena11
PPT
Rhetoric overview
ProfBeckehimer
DOCX
Cerita sangkuriang dalam bahasa inggris dan artinya
Fahrudin Azhar
Storyboard final p is for psycho
haastrud
Fierce resistance
stuszynski
E book (murny, farhana, paraathi)
nurulmurny
Movie trailer
haastrud
Yr 8 h lesson food
Athena11
Preservation of born digital commercial films
stuszynski
Amended
haastrud
Siirde muru
m8markus
The historical background of sumpang bita
Muh Azwar
Siirdemuru
m8markus
Battlefield
haastrud
Dange In Natural
Muh Azwar
Statement of intent
haastrud
Technology teaching college writing class
ProfBeckehimer
Greek cities
Athena11
Rhetoric overview
ProfBeckehimer
Cerita sangkuriang dalam bahasa inggris dan artinya
Fahrudin Azhar
Ad

Similar to Afs banking (20)

PPTX
Rahul Mehrotra Presentation on Reliance Financial Ratio
INSTITUTE of TECHNOLOGY and SCIENCE(ITS) Mohan Nagar, Ghaziabad
PPTX
ratio analysis assignment
Shefali Dadarwal
XLSX
Credit Analysis of HCC Excel
Srivathsa Chakravarthy
PPTX
portfolio management
Harsha Matta
PPTX
ppt on acc cements financial ratios, and cash flow analysis
parijatnath1990
PDF
Jsw Ipo
Kunal
PDF
Financial analysis coal india
Shoaib Shaikh
PDF
Pantaloon 2008 2009
pulkit bansal
DOCX
Finance reporting analysis
Kuldeep Yadav
XLS
Capita template2
Santosh Sridharan
PDF
Aqua Logistics
Kunal
DOCX
Balance sheet
Prathap H Muthu
PPTX
Portfolio management
Harsha Matta
XLS
Rdos2004 ifrs
telefonica
PPT
Larsen & toubro.ppt_25
Jitendra Kumar, CFA
XLSX
Crisil data
Raja Sekharan
PDF
state street corp stt_finrev02
finance23
PDF
state street corp stt_finrev02
finance23
PDF
Annual financial performance 2010 mcb bank limited
shamsherkhan
Rahul Mehrotra Presentation on Reliance Financial Ratio
INSTITUTE of TECHNOLOGY and SCIENCE(ITS) Mohan Nagar, Ghaziabad
ratio analysis assignment
Shefali Dadarwal
Credit Analysis of HCC Excel
Srivathsa Chakravarthy
portfolio management
Harsha Matta
ppt on acc cements financial ratios, and cash flow analysis
parijatnath1990
Jsw Ipo
Kunal
Financial analysis coal india
Shoaib Shaikh
Pantaloon 2008 2009
pulkit bansal
Finance reporting analysis
Kuldeep Yadav
Capita template2
Santosh Sridharan
Aqua Logistics
Kunal
Balance sheet
Prathap H Muthu
Portfolio management
Harsha Matta
Rdos2004 ifrs
telefonica
Larsen & toubro.ppt_25
Jitendra Kumar, CFA
Crisil data
Raja Sekharan
state street corp stt_finrev02
finance23
state street corp stt_finrev02
finance23
Annual financial performance 2010 mcb bank limited
shamsherkhan
Ad

Afs banking

  • 1. PRESENTED BY : Swapnil Turakane Deepanjali Ahire Akshaya Lad Nikita Rane Gaurav Tarkar.
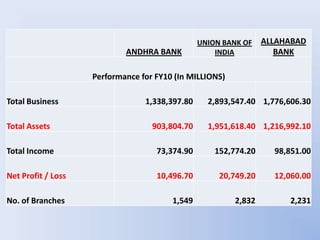
  • 2. UNION BANK OF ALLAHABAD ANDHRA BANK INDIA BANK Performance for FY10 (In MILLIONS) Total Business 1,338,397.80 2,893,547.40 1,776,606.30 Total Assets 903,804.70 1,951,618.40 1,216,992.10 Total Income 73,374.90 152,774.20 98,851.00 Net Profit / Loss 10,496.70 20,749.20 12,060.00 No. of Branches 1,549 2,832 2,231
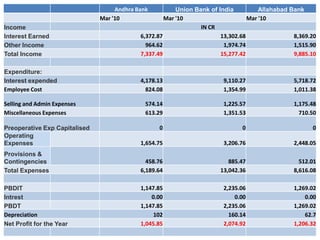
  • 3. Andhra Bank Union Bank of India Allahabad Bank Mar '10 Mar '10 Mar '10 Income IN CR Interest Earned 6,372.87 13,302.68 8,369.20 Other Income 964.62 1,974.74 1,515.90 Total Income 7,337.49 15,277.42 9,885.10 Expenditure: Interest expended 4,178.13 9,110.27 5,718.72 Employee Cost 824.08 1,354.99 1,011.38 Selling and Admin Expenses 574.14 1,225.57 1,175.48 Miscellaneous Expenses 613.29 1,351.53 710.50 Preoperative Exp Capitalised 0 0 0 Operating Expenses 1,654.75 3,206.76 2,448.05 Provisions & Contingencies 458.76 885.47 512.01 Total Expenses 6,189.64 13,042.36 8,616.08 PBDIT 1,147.85 2,235.06 1,269.02 Intrest 0.00 0.00 0.00 PBDT 1,147.85 2,235.06 1,269.02 Depreciation 102 160.14 62.7 Net Profit for the Year 1,045.85 2,074.92 1,206.32
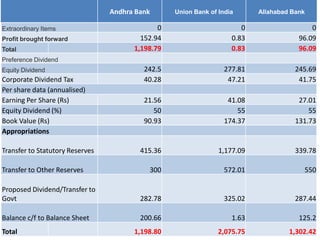
  • 4. Andhra Bank Union Bank of India Allahabad Bank Extraordinary Items 0 0 0 Profit brought forward 152.94 0.83 96.09 Total 1,198.79 0.83 96.09 Preference Dividend Equity Dividend 242.5 277.81 245.69 Corporate Dividend Tax 40.28 47.21 41.75 Per share data (annualised) Earning Per Share (Rs) 21.56 41.08 27.01 Equity Dividend (%) 50 55 55 Book Value (Rs) 90.93 174.37 131.73 Appropriations Transfer to Statutory Reserves 415.36 1,177.09 339.78 Transfer to Other Reserves 300 572.01 550 Proposed Dividend/Transfer to Govt 282.78 325.02 287.44 Balance c/f to Balance Sheet 200.66 1.63 125.2 Total 1,198.80 2,075.75 1,302.42
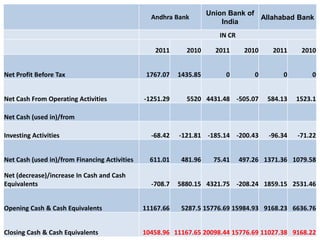
  • 5. Union Bank of Andhra Bank Allahabad Bank India IN CR 2011 2010 2011 2010 2011 2010 Net Profit Before Tax 1767.07 1435.85 0 0 0 0 Net Cash From Operating Activities -1251.29 5520 4431.48 -505.07 584.13 1523.1 Net Cash (used in)/from Investing Activities -68.42 -121.81 -185.14 -200.43 -96.34 -71.22 Net Cash (used in)/from Financing Activities 611.01 481.96 75.41 497.26 1371.36 1079.58 Net (decrease)/increase In Cash and Cash Equivalents -708.7 5880.15 4321.75 -208.24 1859.15 2531.46 Opening Cash & Cash Equivalents 11167.66 5287.5 15776.69 15984.93 9168.23 6636.76 Closing Cash & Cash Equivalents 10458.96 11167.65 20098.44 15776.69 11027.38 9168.22
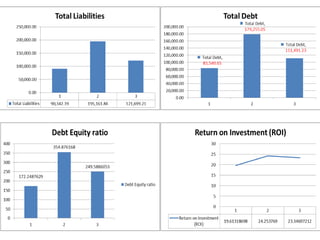
  • 6. Mar '10 Mar '10 Mar '10 Proprietary ratio 0.022265 0.020148 0.023808 Debt Equity ratio 172.2488 354.8762 249.5886 Quick ratio 0.768869 0.721239 0.684233 Operating Expenses ratio 25.96554 24.10612 29.2507 Expenses ratio: Selling & admn exps ratio 0.090091 0.09213 0.140453 Net Profit ratio 16.41097 15.59776 14.4138 Return on Investment (ROI) 19.61319 24.25377 23.34697 Divident per share 5.830515 6.434765 6.434744 Return on Equity Capital 165.6392 355.7788 215.0504