際際滷

際際滷Share a Scribd company logo
ANALYSE AND INTERPRETATION OF TEST SCORES


Pie Chart


                Score ( x )             Frequency ( f )
                    25                        1
                    24                        1
                    21                        3
                    20                        3
                    19                        3
                    18                        2
                    17                        3
                    16                        3
                    15                        3
                    14                        2
                    13                        2
                    11                        1
                    10                        1
                    9                         2
                  Total                       30
Pie Chart of 3 Dinamik Scores
                                                   25     24
                                   10
                              11                   3%     3%
                        13         3%
                              3%
                        7%                   9
                                                           21
                                            7%
                                                          10%
                                                                      20
                 14
                                                                     10%
                 7%
                         15                                            19
                        10%                                           10%
                                    16                          18
                                   10%            17            7%
                                                 10%


The pie chart shows that:

   1. 3% represents only 1 candidate who obtains 25 marks, 24 marks, 11 marks and 10 marks.
   2. 7% represents 2 candidates who obtain 18 marks, 14 marks, 13 marks, and 9 marks.
   3. 10% represents 3 candidates who obtain 21 marks, 20 marks, 19 marks, 17 marks, 16 marks and
       15 marks.
Histogram


            Class Interval                           Class Boundary                          Frequency


                      9  11                           8.5  11.5                                 4

                  12  14                              11.5  14.5                                4

                  15  17                              14.5  17.5                                9

                  18  20                              17.5  20.5                                8

                  21  23                              20.5  23.5                                3

                  24 26                               23.5  26.5                                2

                                       Total                                                     30


                                   Histogram of 3 Dinamik Scores
                 10
                  9
                  8
                  7
     Frequency


                  6
                  5
                  4
                  3
                  2
                  1
                  0
                          8.5  11.5   11.5  14.5   14.5  17.5     17.5  20.5   20.5  23.5   23.5  26.5
                                                              Scores
From the histogram, we can conclude that:

   1. The score which most candidates obtained is 14.5-17.5.
   2. The number of candidates who obtained the most scores within 14.5-17.5 is 9.
   3. The total number of candidates who obtained sores within 17.5-20.5 is 8.
   4. On the whole, the performance of the candidates is satisfactory because half of the candidates
       obtained high marks.
Frequency Polygon


   Class Interval            Class Boundary               Class Mark                 Frequency


             9  11              8.5  11.5                    10                         4

          12  14               11.5  14.5                    13                         4

          15  17               14.5  17.5                    16                         9

          18  20               17.5  20.5                    19                         8

          21  23               20.5  23.5                    22                         3

           24 26               23.5  26.5                    25                         2

                                 Total                                                    30


                      Frequency Polygon of 3 Dinamik Scores
                 10
                  9
                  8
                  7
     Frequency


                  6
                  5
                  4
                  3
                  2
                  1
                  0
                      0    8.5  11.5 11.5  14.5 14.5  17.5 17.5  20.5 20.5  23.5 23.5  26.5
                                                    Scores
Frequency Curve of 3 Dinamik Scores
            10
             9
             8
             7
Frequency


             6
             5
             4
             3
             2
             1
             0
                 0     1      2      3            4   5    6   7
                                         Scores
Ogive


                                                                                                    Cumulative
       Class Interval           Upper Class Boundary                  Frequency
                                                                                                     Frequency

               9  11                         11.5                           4                               4

              12  14                         14.5                           4                               8

              15  17                         17.5                           9                               17

              18  20                         20.5                           8                               25

              21  23                         23.5                           3                               28

               24 26                         26.5                           2                               30


                                Ogive of 3 Dinamik Scores
              35

              30

              25
  Frequency


              20

              15

              10

               5

               0
                                                     15
                   8.5  11.5   11.5  14.5      14.5  17.5   17.5  20.5       20.5  23.5   23.5  26.5
                                                          Scores
Percentage Ogive


                                                                                                       Percentage
                                     Upper Class                                   Cumulative
 Class Interval                                              Frequency                                 Cumulative
                                     Boundary                                       Frequency
                                                                                                        Frequency

              9  11                     11.5                     4                      4                  13.3

              12  14                    14.5                     4                      8                  26.7

              15  17                    17.5                     9                      17                 56.7

              18  20                    20.5                     8                      25                 83.3

              21  23                    23.5                     3                      28                 93.3

              24 26                     26.5                     2                      30                 100

                            Total                                 30


                           Percentage Ogive of 3 Dinamik Scores
               35

               30                                                                                    100%

               25
                                                                                                     75%
  Frequency


               20

               15                                                                                    50%

               10
                                                                                                     25%
                5

                0
                        8.5  11.5    11.5  14.5   14.5  17.5   17.5  20.5   20.5  23.5   23.5  26.5
                                                             Scores
From the ogive, we can find that:

    1. The number of candidates who failed, if the passing mark is 15 marks are 8 candidates.
    2. The number of candidates who would obtain grade A, if grade A is 25 marks and above is only
        one candidate.


Scatter plots


                         Score ( x )                            Frequency ( f )
                             25                                         1
                             24                                         1
                             21                                         3
                             20                                         3
                             19                                         3
                             18                                         2
                             17                                         3
                             16                                         3
                             15                                         3
                             14                                         2
                             13                                         2
                             11                                         1
                             10                                         1
                             9                                          2
                           Total                                       30
Scatter Plots of 3 Dinamik Scores
               3.5

                3

               2.5
   Frequency


                2

               1.5

                1

               0.5

                0
                     0     5           10         15           20         25   30
                                                Scores


From the scatter plots, we can find that:

    1. There are 3 groups of pupils: high, moderate and low performers.
MEASURES OF CENTRAL TENDENCY


Mean, Median and Mod


  Class Interval ( x )   Class Mark ( x )   Frequency ( f )   (f)(x)


        9  11                 10                 4             40

        12  14                13                 4             52

        15  17                16                 9            144

        18  20                19                 8            152

        21  23                22                 3             66

        24 26                 25                 2             50


Mean,
Median,


Where L =        lower class boundary of median class

      N=         number of items in data

      s=         cumulative frequency of all classes prior to the median class

            =   frequency of median class

      C=         size of median class interval


      Class Boundary                             Frequency                  Cumulative Frequency

            8.5  11.5                               4                               4

            11.5  14.5                              4                               8

           14.5  17.5                               9                              17

            17.5  20.5                              8                              25

            20.5  23.5                              3                              28

            23.5  26.5                              2                              30
Mode,


Where L =        lower class boundary of modal class

             =   frequency of modal class  frequency before modal class

             =   frequency of modal class  frequency after modal class

        C=       class width


                 Class Boundary                                           Frequency

                     8.5  11.5                                               4

                    11.5  14.5                                               4

                    14.5  17.5                                               9

                    17.5  20.5                                               8

                    20.5  23.5                                               3

                    23.5  26.5                                               2
Mode obtained from histogram :


                             Histogram of 3 Dinamik Scores
               10
                9
                8                                            Mode
                7
   Frequency


                6
                5
                4
                3
                2
                1
                0
                                                        17
                    8.5  11.5   11.5  14.5   14.5  17.5   17.5  20.5   20.5  23.5   23.5  26.5
                                                        Scores
MEASURES OF VARIABILITY

Range, Variance and Standard Deviation


Range =       Highest Score  Lowest Score

      =       25  9

      =       16


                                                                Differences Squared,
          Score ( x )                   Differences,

              25                             25  16.8 = 8.2           67.24
              24                             24  16.8 = 7.2           51.84
              21                             21  16.8 = 4.2           17.64
              20                             20  16.8 = 3.2           10.24
              19                             19  16.8 = 2.2            4.84
              18                             18  16.8 = 1.2            1.44
              17                             17  16.8 = 0.2            0.04
              16                             16  16.8 = -0.8           0.64
              15                             15  16.8 = -1.8           3.24
              14                             14  16.8 = -2.8           7.84
              13                             13  16.8 = -3.8          14.44
              11                             11  16.8 = -5.8          33.64
              10                             10  16.8 = -6.8          46.24
              9                              9  16.8 = -7.8           60.84
          Total = 232                                              Total = 320.16
Variance


       =


       =

       =


Standard Deviation


       =


       =


       =

       =

More Related Content

Analyse and intepretation of test scores

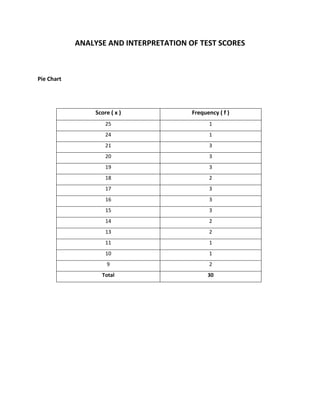
  • 1. ANALYSE AND INTERPRETATION OF TEST SCORES Pie Chart Score ( x ) Frequency ( f ) 25 1 24 1 21 3 20 3 19 3 18 2 17 3 16 3 15 3 14 2 13 2 11 1 10 1 9 2 Total 30
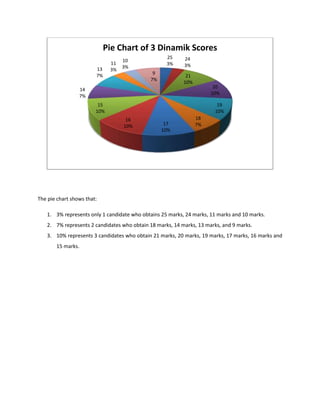
  • 2. Pie Chart of 3 Dinamik Scores 25 24 10 11 3% 3% 13 3% 3% 7% 9 21 7% 10% 20 14 10% 7% 15 19 10% 10% 16 18 10% 17 7% 10% The pie chart shows that: 1. 3% represents only 1 candidate who obtains 25 marks, 24 marks, 11 marks and 10 marks. 2. 7% represents 2 candidates who obtain 18 marks, 14 marks, 13 marks, and 9 marks. 3. 10% represents 3 candidates who obtain 21 marks, 20 marks, 19 marks, 17 marks, 16 marks and 15 marks.
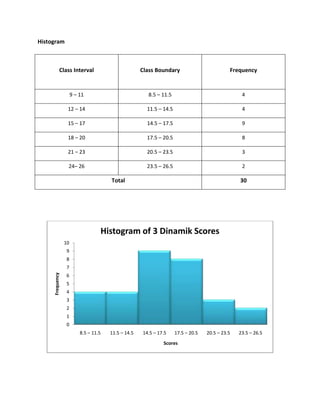
  • 3. Histogram Class Interval Class Boundary Frequency 9 11 8.5 11.5 4 12 14 11.5 14.5 4 15 17 14.5 17.5 9 18 20 17.5 20.5 8 21 23 20.5 23.5 3 24 26 23.5 26.5 2 Total 30 Histogram of 3 Dinamik Scores 10 9 8 7 Frequency 6 5 4 3 2 1 0 8.5 11.5 11.5 14.5 14.5 17.5 17.5 20.5 20.5 23.5 23.5 26.5 Scores
  • 4. From the histogram, we can conclude that: 1. The score which most candidates obtained is 14.5-17.5. 2. The number of candidates who obtained the most scores within 14.5-17.5 is 9. 3. The total number of candidates who obtained sores within 17.5-20.5 is 8. 4. On the whole, the performance of the candidates is satisfactory because half of the candidates obtained high marks.
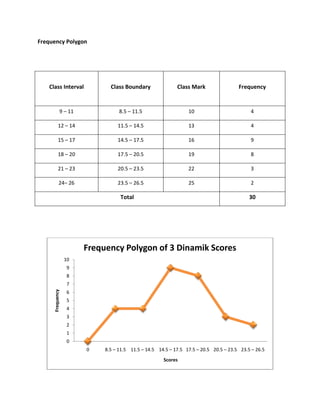
  • 5. Frequency Polygon Class Interval Class Boundary Class Mark Frequency 9 11 8.5 11.5 10 4 12 14 11.5 14.5 13 4 15 17 14.5 17.5 16 9 18 20 17.5 20.5 19 8 21 23 20.5 23.5 22 3 24 26 23.5 26.5 25 2 Total 30 Frequency Polygon of 3 Dinamik Scores 10 9 8 7 Frequency 6 5 4 3 2 1 0 0 8.5 11.5 11.5 14.5 14.5 17.5 17.5 20.5 20.5 23.5 23.5 26.5 Scores
  • 6. Frequency Curve of 3 Dinamik Scores 10 9 8 7 Frequency 6 5 4 3 2 1 0 0 1 2 3 4 5 6 7 Scores
  • 7. Ogive Cumulative Class Interval Upper Class Boundary Frequency Frequency 9 11 11.5 4 4 12 14 14.5 4 8 15 17 17.5 9 17 18 20 20.5 8 25 21 23 23.5 3 28 24 26 26.5 2 30 Ogive of 3 Dinamik Scores 35 30 25 Frequency 20 15 10 5 0 15 8.5 11.5 11.5 14.5 14.5 17.5 17.5 20.5 20.5 23.5 23.5 26.5 Scores
  • 8. Percentage Ogive Percentage Upper Class Cumulative Class Interval Frequency Cumulative Boundary Frequency Frequency 9 11 11.5 4 4 13.3 12 14 14.5 4 8 26.7 15 17 17.5 9 17 56.7 18 20 20.5 8 25 83.3 21 23 23.5 3 28 93.3 24 26 26.5 2 30 100 Total 30 Percentage Ogive of 3 Dinamik Scores 35 30 100% 25 75% Frequency 20 15 50% 10 25% 5 0 8.5 11.5 11.5 14.5 14.5 17.5 17.5 20.5 20.5 23.5 23.5 26.5 Scores
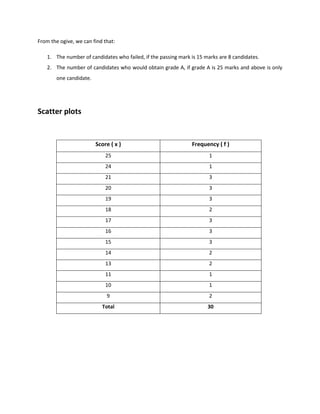
  • 9. From the ogive, we can find that: 1. The number of candidates who failed, if the passing mark is 15 marks are 8 candidates. 2. The number of candidates who would obtain grade A, if grade A is 25 marks and above is only one candidate. Scatter plots Score ( x ) Frequency ( f ) 25 1 24 1 21 3 20 3 19 3 18 2 17 3 16 3 15 3 14 2 13 2 11 1 10 1 9 2 Total 30
  • 10. Scatter Plots of 3 Dinamik Scores 3.5 3 2.5 Frequency 2 1.5 1 0.5 0 0 5 10 15 20 25 30 Scores From the scatter plots, we can find that: 1. There are 3 groups of pupils: high, moderate and low performers.
  • 11. MEASURES OF CENTRAL TENDENCY Mean, Median and Mod Class Interval ( x ) Class Mark ( x ) Frequency ( f ) (f)(x) 9 11 10 4 40 12 14 13 4 52 15 17 16 9 144 18 20 19 8 152 21 23 22 3 66 24 26 25 2 50 Mean,
  • 12. Median, Where L = lower class boundary of median class N= number of items in data s= cumulative frequency of all classes prior to the median class = frequency of median class C= size of median class interval Class Boundary Frequency Cumulative Frequency 8.5 11.5 4 4 11.5 14.5 4 8 14.5 17.5 9 17 17.5 20.5 8 25 20.5 23.5 3 28 23.5 26.5 2 30
  • 13. Mode, Where L = lower class boundary of modal class = frequency of modal class frequency before modal class = frequency of modal class frequency after modal class C= class width Class Boundary Frequency 8.5 11.5 4 11.5 14.5 4 14.5 17.5 9 17.5 20.5 8 20.5 23.5 3 23.5 26.5 2
  • 14. Mode obtained from histogram : Histogram of 3 Dinamik Scores 10 9 8 Mode 7 Frequency 6 5 4 3 2 1 0 17 8.5 11.5 11.5 14.5 14.5 17.5 17.5 20.5 20.5 23.5 23.5 26.5 Scores
  • 15. MEASURES OF VARIABILITY Range, Variance and Standard Deviation Range = Highest Score Lowest Score = 25 9 = 16 Differences Squared, Score ( x ) Differences, 25 25 16.8 = 8.2 67.24 24 24 16.8 = 7.2 51.84 21 21 16.8 = 4.2 17.64 20 20 16.8 = 3.2 10.24 19 19 16.8 = 2.2 4.84 18 18 16.8 = 1.2 1.44 17 17 16.8 = 0.2 0.04 16 16 16.8 = -0.8 0.64 15 15 16.8 = -1.8 3.24 14 14 16.8 = -2.8 7.84 13 13 16.8 = -3.8 14.44 11 11 16.8 = -5.8 33.64 10 10 16.8 = -6.8 46.24 9 9 16.8 = -7.8 60.84 Total = 232 Total = 320.16
  • 16. Variance = = = Standard Deviation = = = =