際際滷

際際滷Share a Scribd company logo
ONE-WAY ANALYSIS OF VARIANCE (ANOVA)
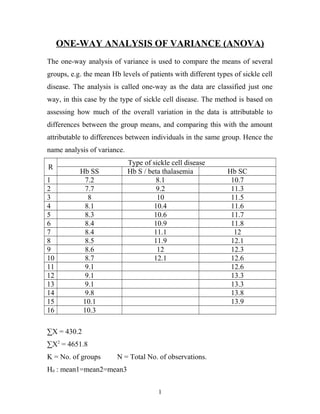
The one-way analysis of variance is used to compare the means of several
groups, e.g. the mean Hb levels of patients with different types of sickle cell
disease. The analysis is called one-way as the data are classified just one
way, in this case by the type of sickle cell disease. The method is based on
assessing how much of the overall variation in the data is attributable to
differences between the group means, and comparing this with the amount
attributable to differences between individuals in the same group. Hence the
name analysis of variance.
R
Type of sickle cell disease
Hb SS Hb S / beta thalasemia Hb SC
1 7.2 8.1 10.7
2 7.7 9.2 11.3
3 8 10 11.5
4 8.1 10.4 11.6
5 8.3 10.6 11.7
6 8.4 10.9 11.8
7 8.4 11.1 12
8 8.5 11.9 12.1
9 8.6 12 12.3
10 8.7 12.1 12.6
11 9.1 12.6
12 9.1 13.3
13 9.1 13.3
14 9.8 13.8
15 10.1 13.9
16 10.3
X = 430.2
X2
= 4651.8
K = No. of groups N = Total No. of observations.
H0 : mean1=mean2=mean3
1
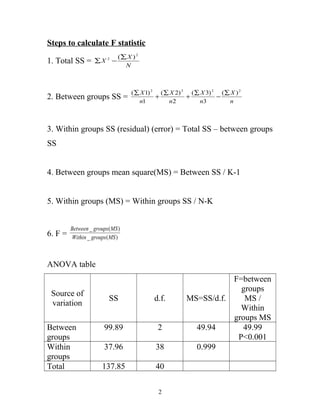
Steps to calculate F statistic
1. Total SS = N
X
X
2
2 )(

2. Between groups SS = n
X
n
X
n
X
n
X 2222
)(
3
)3(
2
)2(
1
)1( 


+

+

3. Within groups SS (residual) (error) = Total SS  between groups
SS
4. Between groups mean square(MS) = Between SS / K-1
5. Within groups (MS) = Within groups SS / N-K
6. F = )(_
)(_
MSgroupsWithin
MSgroupsBetween
ANOVA table
Source of
variation
SS d.f. MS=SS/d.f.
F=between
groups
MS /
Within
groups MS
Between
groups
99.89 2 49.94 49.99
P<0.001
Within
groups
37.96 38 0.999
Total 137.85 40
2
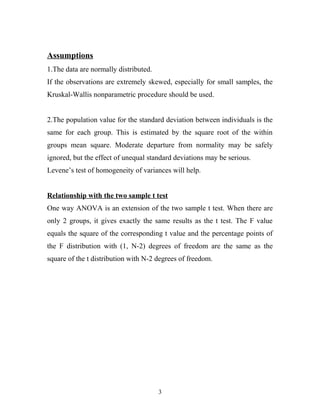
Assumptions
1.The data are normally distributed.
If the observations are extremely skewed, especially for small samples, the
Kruskal-Wallis nonparametric procedure should be used.
2.The population value for the standard deviation between individuals is the
same for each group. This is estimated by the square root of the within
groups mean square. Moderate departure from normality may be safely
ignored, but the effect of unequal standard deviations may be serious.
Levenes test of homogeneity of variances will help.
Relationship with the two sample t test
One way ANOVA is an extension of the two sample t test. When there are
only 2 groups, it gives exactly the same results as the t test. The F value
equals the square of the corresponding t value and the percentage points of
the F distribution with (1, N-2) degrees of freedom are the same as the
square of the t distribution with N-2 degrees of freedom.
3

More Related Content

Similar to Analysis of variance (20)

PPT
lecture12.ppt
Nimish Savaliya
PPT
oneway ANOVA.ppt
Neha Madan
PPTX
F test and ANOVA
MEENURANJI
PPT
Anova (Analysis of variation)
Shakeel Rehman
PPTX
ANOVA One way ppt statistics.pptx
agtech7
PPT
anova & analysis of variance pearson.ppt
DrPARVATHYVINOD
PPT
anova.ppt
swetachaudhari7
DOCX
ANOVA SNEHA.docx
SNEHA AGRAWAL GUPTA
PPTX
Analysis of variance
Ravi Rohilla
PPTX
ANOVA BIOstat short explaination .pptx
DrDeveshPandey1
PPT
ANOVAs01.ppt
Elisha Gogo
PPT
ANOVAs01.ppt
Satyendra Singh Yadav
PPT
ANOVAs01.ppt nnnnnnnnnnnnnnnnnnnnnnnnnnnnnnnnn
imtiaz waheed
PPT
ANOVAs01.ppt KHLUGYIFTFYLYUGUH;OUYYUHJLNOI
prasad439227
PPT
ANOVAs01.ppt
Mishimehar1
PPT
ANOVAs01.ppt
NivedhanK1
PPT
ANOVAs01.ppt
GarrinBioinformatics
PPT
Anova by Hazilah Mohd Amin
HazilahMohd
PPT
Anova test
maheshkapadiya11
PPTX
ANOVA Analysis of Varianace Biostatistics
Muslim Institute of Education
lecture12.ppt
Nimish Savaliya
oneway ANOVA.ppt
Neha Madan
F test and ANOVA
MEENURANJI
Anova (Analysis of variation)
Shakeel Rehman
ANOVA One way ppt statistics.pptx
agtech7
anova & analysis of variance pearson.ppt
DrPARVATHYVINOD
anova.ppt
swetachaudhari7
ANOVA SNEHA.docx
SNEHA AGRAWAL GUPTA
Analysis of variance
Ravi Rohilla
ANOVA BIOstat short explaination .pptx
DrDeveshPandey1
ANOVAs01.ppt
Elisha Gogo
ANOVAs01.ppt
Satyendra Singh Yadav
ANOVAs01.ppt nnnnnnnnnnnnnnnnnnnnnnnnnnnnnnnnn
imtiaz waheed
ANOVAs01.ppt KHLUGYIFTFYLYUGUH;OUYYUHJLNOI
prasad439227
ANOVAs01.ppt
Mishimehar1
ANOVAs01.ppt
NivedhanK1
ANOVAs01.ppt
GarrinBioinformatics
Anova by Hazilah Mohd Amin
HazilahMohd
Anova test
maheshkapadiya11
ANOVA Analysis of Varianace Biostatistics
Muslim Institute of Education

More from Forensic Pathology (20)

PDF
悋惶忰悸 悋悒悴悋惡悸 忰悋悸 悋惘悋 悋惡惆 悋惺 悋悋悴惠悋惺 悋惠 惠愆 悴惺 悴...
Forensic Pathology
PDF
Stat3 central tendency & dispersion
Forensic Pathology
DOC
Writing a research protocol 2011
Forensic Pathology
DOC
Prac excises 3[1].5
Forensic Pathology
PPT
Stat6 chi square test
Forensic Pathology
PPT
Stat5 the t test
Forensic Pathology
PPT
Stat3 central tendency & dispersion
Forensic Pathology
PPT
Stat 4 the normal distribution & steps of testing hypothesis
Forensic Pathology
PPT
Stat 2 data presentation2
Forensic Pathology
PPT
Correlation 3rd
Forensic Pathology
PPT
Stat 1 variables & sampling
Forensic Pathology
PPTX
Pancreas 2
Forensic Pathology
PPTX
Pancreas 1
Forensic Pathology
PPTX
Liver 3
Forensic Pathology
PPTX
Liver 2
Forensic Pathology
PPTX
Liver 1
Forensic Pathology
PPTX
The biliary tract
Forensic Pathology
PPTX
Valvular heart diseases 4
Forensic Pathology
PPTX
Pericardial dis.&cardiactumors 5
Forensic Pathology
PPTX
Ischemic heart diseases 2
Forensic Pathology
悋惶忰悸 悋悒悴悋惡悸 忰悋悸 悋惘悋 悋惡惆 悋惺 悋悋悴惠悋惺 悋惠 惠愆 悴惺 悴...
Forensic Pathology
Stat3 central tendency & dispersion
Forensic Pathology
Writing a research protocol 2011
Forensic Pathology
Prac excises 3[1].5
Forensic Pathology
Stat6 chi square test
Forensic Pathology
Stat5 the t test
Forensic Pathology
Stat3 central tendency & dispersion
Forensic Pathology
Stat 4 the normal distribution & steps of testing hypothesis
Forensic Pathology
Stat 2 data presentation2
Forensic Pathology
Correlation 3rd
Forensic Pathology
Stat 1 variables & sampling
Forensic Pathology
Pancreas 2
Forensic Pathology
Pancreas 1
Forensic Pathology
The biliary tract
Forensic Pathology
Valvular heart diseases 4
Forensic Pathology
Pericardial dis.&cardiactumors 5
Forensic Pathology
Ischemic heart diseases 2
Forensic Pathology
Ad

Recently uploaded (20)

PDF
Rapid Mathematics Assessment Score sheet for all Grade levels
DessaCletSantos
PPTX
How to Setup Automatic Reordering Rule in Odoo 18 Inventory
Celine George
PPTX
Elo the HeroTHIS IS A STORY ABOUT A BOY WHO SAVED A LITTLE GOAT .pptx
JoyIPanos
PDF
THE PSYCHOANALYTIC OF THE BLACK CAT BY EDGAR ALLAN POE (1).pdf
nabilahk908
PPTX
2025 Completing the Pre-SET Plan Form.pptx
mansk2
PPT
M&A5 Q1 1 differentiate evolving early Philippine conventional and contempora...
ErlizaRosete
PPTX
A Case of Identity A Sociological Approach Fix.pptx
Ismail868386
PDF
CAD25 Gbadago and Fafa Presentation Revised-Aston Business School, UK.pdf
Kweku Zurek
PDF
Supply Chain Security A Comprehensive Approach 1st Edition Arthur G. Arway
rxgnika452
PDF
Gladiolous Cultivation practices by AKL.pdf
kushallamichhame
PDF
VCE Literature Section A Exam Response Guide
jpinnuck
PDF
Our Guide to the July 2025 USPS速 Rate Change
Postal Advocate Inc.
PDF
Learning Styles Inventory for Senior High School Students
Thelma Villaflores
PPTX
JSON, XML and Data Science introduction.pptx
Ramakrishna Reddy Bijjam
PPTX
How to Configure Taxes in Company Currency in Odoo 18 Accounting
Celine George
PPTX
Tanja Vujicic - PISA for Schools contact Info
EduSkills OECD
PDF
Romanticism in Love and Sacrifice An Analysis of Oscar Wildes The Nightingal...
KaryanaTantri21
PPTX
Project 4 PART 1 AI Assistant Vocational Education
barmanjit380
PPTX
Peer Teaching Observations During School Internship
AjayaMohanty7
PPTX
Aerobic and Anaerobic respiration and CPR.pptx
Olivier Rochester
Rapid Mathematics Assessment Score sheet for all Grade levels
DessaCletSantos
How to Setup Automatic Reordering Rule in Odoo 18 Inventory
Celine George
Elo the HeroTHIS IS A STORY ABOUT A BOY WHO SAVED A LITTLE GOAT .pptx
JoyIPanos
THE PSYCHOANALYTIC OF THE BLACK CAT BY EDGAR ALLAN POE (1).pdf
nabilahk908
2025 Completing the Pre-SET Plan Form.pptx
mansk2
M&A5 Q1 1 differentiate evolving early Philippine conventional and contempora...
ErlizaRosete
A Case of Identity A Sociological Approach Fix.pptx
Ismail868386
CAD25 Gbadago and Fafa Presentation Revised-Aston Business School, UK.pdf
Kweku Zurek
Supply Chain Security A Comprehensive Approach 1st Edition Arthur G. Arway
rxgnika452
Gladiolous Cultivation practices by AKL.pdf
kushallamichhame
VCE Literature Section A Exam Response Guide
jpinnuck
Our Guide to the July 2025 USPS速 Rate Change
Postal Advocate Inc.
Learning Styles Inventory for Senior High School Students
Thelma Villaflores
JSON, XML and Data Science introduction.pptx
Ramakrishna Reddy Bijjam
How to Configure Taxes in Company Currency in Odoo 18 Accounting
Celine George
Tanja Vujicic - PISA for Schools contact Info
EduSkills OECD
Romanticism in Love and Sacrifice An Analysis of Oscar Wildes The Nightingal...
KaryanaTantri21
Project 4 PART 1 AI Assistant Vocational Education
barmanjit380
Peer Teaching Observations During School Internship
AjayaMohanty7
Aerobic and Anaerobic respiration and CPR.pptx
Olivier Rochester
Ad

Analysis of variance

  • 1. ONE-WAY ANALYSIS OF VARIANCE (ANOVA) The one-way analysis of variance is used to compare the means of several groups, e.g. the mean Hb levels of patients with different types of sickle cell disease. The analysis is called one-way as the data are classified just one way, in this case by the type of sickle cell disease. The method is based on assessing how much of the overall variation in the data is attributable to differences between the group means, and comparing this with the amount attributable to differences between individuals in the same group. Hence the name analysis of variance. R Type of sickle cell disease Hb SS Hb S / beta thalasemia Hb SC 1 7.2 8.1 10.7 2 7.7 9.2 11.3 3 8 10 11.5 4 8.1 10.4 11.6 5 8.3 10.6 11.7 6 8.4 10.9 11.8 7 8.4 11.1 12 8 8.5 11.9 12.1 9 8.6 12 12.3 10 8.7 12.1 12.6 11 9.1 12.6 12 9.1 13.3 13 9.1 13.3 14 9.8 13.8 15 10.1 13.9 16 10.3 X = 430.2 X2 = 4651.8 K = No. of groups N = Total No. of observations. H0 : mean1=mean2=mean3 1
  • 2. Steps to calculate F statistic 1. Total SS = N X X 2 2 )( 2. Between groups SS = n X n X n X n X 2222 )( 3 )3( 2 )2( 1 )1( + + 3. Within groups SS (residual) (error) = Total SS between groups SS 4. Between groups mean square(MS) = Between SS / K-1 5. Within groups (MS) = Within groups SS / N-K 6. F = )(_ )(_ MSgroupsWithin MSgroupsBetween ANOVA table Source of variation SS d.f. MS=SS/d.f. F=between groups MS / Within groups MS Between groups 99.89 2 49.94 49.99 P<0.001 Within groups 37.96 38 0.999 Total 137.85 40 2
  • 3. Assumptions 1.The data are normally distributed. If the observations are extremely skewed, especially for small samples, the Kruskal-Wallis nonparametric procedure should be used. 2.The population value for the standard deviation between individuals is the same for each group. This is estimated by the square root of the within groups mean square. Moderate departure from normality may be safely ignored, but the effect of unequal standard deviations may be serious. Levenes test of homogeneity of variances will help. Relationship with the two sample t test One way ANOVA is an extension of the two sample t test. When there are only 2 groups, it gives exactly the same results as the t test. The F value equals the square of the corresponding t value and the percentage points of the F distribution with (1, N-2) degrees of freedom are the same as the square of the t distribution with N-2 degrees of freedom. 3