Analysis using SPSS - H.H.The Rajha's College
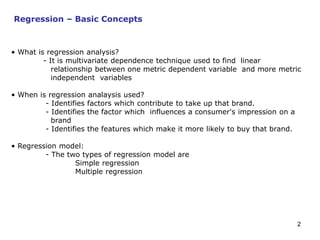
- 2. 2 Regression ŌĆō Basic Concepts ŌĆó What is regression analysis? - It is multivariate dependence technique used to find linear relationship between one metric dependent variable and more metric independent variables ŌĆó When is regression analaysis used? - Identifies factors which contribute to take up that brand. - Identifies the factor which influences a consumer's impression on a brand - Identifies the features which make it more likely to buy that brand. ŌĆó Regression model: - The two types of regression model are Simple regression Multiple regression
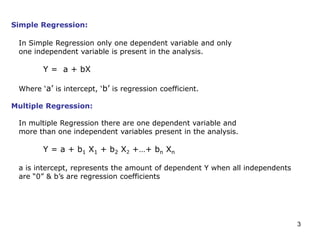
- 3. 3 Simple Regression: In Simple Regression only one dependent variable and only one independent variable is present in the analysis. Y = a + bX Where ŌĆśaŌĆÖ is intercept, ŌĆśbŌĆÖ is regression coefficient. Multiple Regression: In multiple Regression there are one dependent variable and more than one independent variables present in the analysis. Y = a + b1 X1 + b2 X2 +ŌĆ”+ bn Xn a is intercept, represents the amount of dependent Y when all independents are ŌĆ£0ŌĆØ & bŌĆÖs are regression coefficients
- 4. 4 Data Types: Variables in the regression analysis must be metric. Variables used for regression analysis are ŌĆóPrice ŌĆóCost ŌĆóDemand ŌĆóSupply ŌĆóIncome ŌĆóTaste and Preferences
- 5. 5 Normality: -The variables satisfying the properties of normal distribution is termed as normality. - This can be detected using pp-plot or qq-plot ie., plotting expected cumulative probability against observed cumulative probability is pp-plot. Terminologies:
- 6. 6 ŌĆó Linearity: -Straight line relationship between two variables is termed as linear relation or linearity.
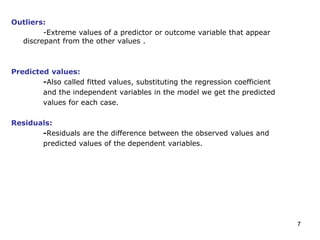
- 7. 7 Outliers: -Extreme values of a predictor or outcome variable that appear discrepant from the other values . Predicted values: -Also called fitted values, substituting the regression coefficient and the independent variables in the model we get the predicted values for each case. Residuals: -Residuals are the difference between the observed values and predicted values of the dependent variables.
- 8. 8 Beta weights: -Standardization of regression coefficient are called Beta Weights. Ratio of Beta weights are the ratio of relative predictive power of the independent variable. R-Square : -Proportion of the variation of dependent variable explained by the independent variable. Adjusted R-Square: -Proportion of the variation of dependent variable explained by the independent variable after adding or deletion of the variables. Multicollinearity: -Inter correlation among the independent variables.
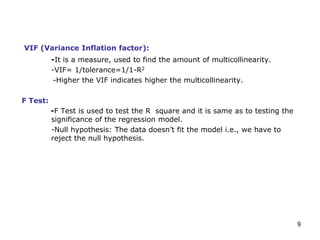
- 9. 9 VIF (Variance Inflation factor): -It is a measure, used to find the amount of multicollinearity. -VIF= 1/tolerance=1/1-R2 -Higher the VIF indicates higher the multicollinearity. F Test: -F Test is used to test the R square and it is same as to testing the significance of the regression model. -Null hypothesis: The data doesnŌĆÖt fit the model i.e., we have to reject the null hypothesis.
- 10. 10 Assumptions: ŌĆó The variables should be metric variables. ŌĆó The sample size should be adequate i.e., each variable should have at least ten observation. ŌĆó Linearity among the dependent and independent should be satisfied. ŌĆó Multicollinearity should be absent. ŌĆó Residuals should be normally distributed. ŌĆó Residuals should satisfy homoscedasticity property. ŌĆó Residuals should be independent. ŌĆó Multivariate normality for variables should be satisfied. ŌĆó No outliers.
- 11. 11 Expected output: ŌĆó Model should be significant i.e., (Pr>F) Ōēż 0.05. ŌĆó VIF should be Ōēż2. ŌĆó Condition index should be Ōēż 15. ŌĆó Independent variable should be significant (Pr >t) Ōēż0.05. ŌĆó Standard estimates tells us the amount of variance of dependent variable explained by that independent variable (tested using significance t test). ŌĆó R square tells the amount of variance explained by the model on the whole (tested using significance F test). ŌĆó Parameter estimates can be negative or positive.
- 12. 12 Thank you ’üŖ


