AnnualMeeting
•Download as PPTX, PDF•
2 likes•332 views

The document provides an overview of VC industry trends in 2013 and performance for Cintrifuse Fund I and the Cintrifuse Fund of Funds. Some key points: - Total VC investments in 2013 were $34 billion, the 3rd highest level in 10 years, though overall deal flow dipped slightly. Seed/angel investments increased significantly. - Cintrifuse Fund I has $450 million under management across 44 companies with an average portfolio growth of 150%. The underlying funds focus on early stage companies in technology, life sciences, consumer and energy. - The Cintrifuse Fund of Funds has $51.1 million committed across 4 underlying funds. Goals for 2014 include closing
AnnualMeeting
- 1. Where connections spark growth. 1
- 2. Where connections spark growth. 2 Agenda  VC Industry Trends  Fund I Performance Review  Cintrifuse Fund of Funds Overview
- 3. Where connections spark growth. 3 2013 VC Industry Trends
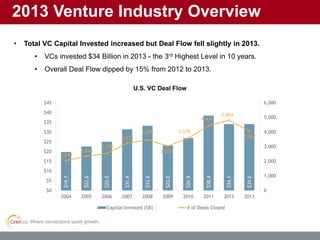
- 4. Where connections spark growth. 2013 Venture Industry Overview • Total VC Capital Invested increased but Deal Flow fell slightly in 2013. • VCs invested $34 Billion in 2013 - the 3rd Highest Level in 10 years. • Overall Deal Flow dipped by 15% from 2012 to 2013. $19.7 $22.6 $25.0 $31.4 $33.2 $23.0 $26.9 $38.4 $34.1 $34.0 2,049 2,344 2,532 3,233 3,459 3,037 3,579 4,431 4,804 4,067 0 1,000 2,000 3,000 4,000 5,000 6,000 $0 $5 $10 $15 $20 $25 $30 $35 $40 $45 2004 2005 2006 2007 2008 2009 2010 2011 2012 2013 Capital Invested ($B) # of Deals Closed U.S. VC Deal Flow
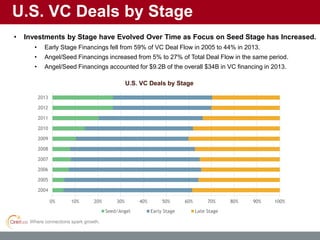
- 5. Where connections spark growth. U.S. VC Deals by Stage • Investments by Stage have Evolved Over Time as Focus on Seed Stage has Increased. • Early Stage Financings fell from 59% of VC Deal Flow in 2005 to 44% in 2013. • Angel/Seed Financings increased from 5% to 27% of Total Deal Flow in the same period. • Angel/Seed Financings accounted for $9.2B of the overall $34B in VC financing in 2013. 0% 10% 20% 30% 40% 50% 60% 70% 80% 90% 100% 2004 2005 2006 2007 2008 2009 2010 2011 2012 2013 Seed/Angel Early Stage Late Stage U.S. VC Deals by Stage
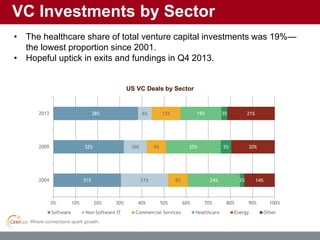
- 6. Where connections spark growth. VC Investments by Sector • The healthcare share of total venture capital investments was 19%— the lowest proportion since 2001. • Hopeful uptick in exits and fundings in Q4 2013. 31% 32% 38% 21% 10% 6% 9% 9% 13% 24% 25% 19% 2% 5% 3% 14% 20% 21% 0% 10% 20% 30% 40% 50% 60% 70% 80% 90% 100% 2004 2009 2013 Software Non-Software IT Commercial Services Healthcare Energy Other US VC Deals by Sector
- 7. Where connections spark growth. 7 Cintrifuse Early Stage Venture Capital Fund I, LLC Performance Review
- 8. Where connections spark growth. Current Investors
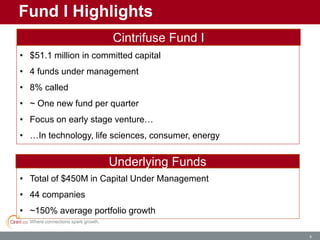
- 9. Where connections spark growth. 9 Fund I Highlights • Total of $450M in Capital Under Management • 44 companies • ~150% average portfolio growth Underlying Funds • $51.1 million in committed capital • 4 funds under management • 8% called • ~ One new fund per quarter • Focus on early stage venture… • …In technology, life sciences, consumer, energy Cintrifuse Fund I
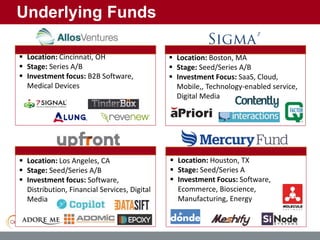
- 10. Where connections spark growth. Underlying Funds  Location: Cincinnati, OH  Stage: Series A/B  Investment focus: B2B Software, Medical Devices  Location: Los Angeles, CA  Stage: Seed/Series A/B  Investment focus: Software, Distribution, Financial Services, Digital Media  Location: Boston, MA  Stage: Seed/Series A/B  Investment Focus: SaaS, Cloud, Mobile,, Technology-enabled service, Digital Media  Location: Houston, TX  Stage: Seed/Series A  Investment Focus: Software, Ecommerce, Bioscience, Manufacturing, Energy
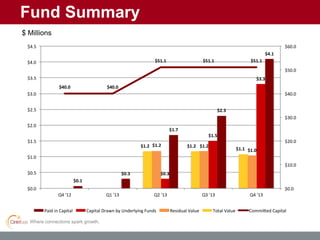
- 11. Where connections spark growth. Fund Summary $ Millions $4.1 $2.3 $1.7 $0.3 $0.1 $3.3 $1.5 $0.3 $1.0 $1.2$1.2 $1.1 $1.2$1.2 $40.0 $40.0 $51.1 $51.1 $51.1 $0.0 $10.0 $20.0 $30.0 $40.0 $50.0 $60.0 $0.0 $0.5 $1.0 $1.5 $2.0 $2.5 $3.0 $3.5 $4.0 $4.5 Q4 '13Q3 '13Q2 '13Q1 '13Q4 '12 Paid in Capital Capital Drawn by Underlying Funds Residual Value Total Value Commi ed Capital
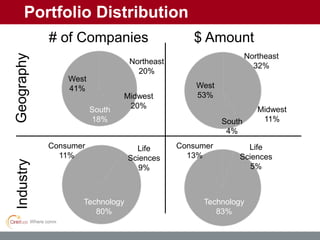
- 12. Where connections spark growth. Portfolio Distribution $ Amount GeographyIndustry # of Companies Consumer 13% Technology 83% Life Sciences 5% Consumer 11% Technology 80% Life Sciences 9% West 41% South 18% Northeast 20% Midwest 20% West 53% South 4% Northeast 32% Midwest 11%
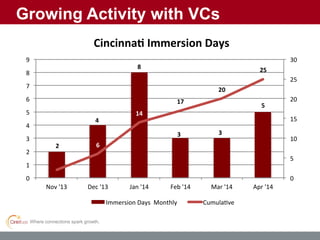
- 13. Where connections spark growth. Growing Activity with VCs 2 4 8 3 3 5 6 14 17 20 25 0 5 10 15 20 25 30 0 1 2 3 4 5 6 7 8 9 Nov '13 Dec '13 Jan '14 Feb '14 Mar '14 Apr '14 Cincinna Immersion Days Immersion Days Monthly Cumula ve
- 14. Where connections spark growth. 14 Cintrifuse Fund of Funds Overview
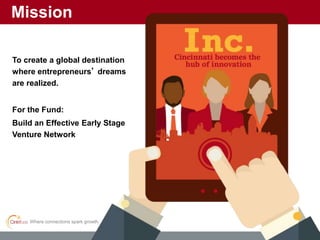
- 15. Where connections spark growth. To create a global destination where entrepreneurs’ dreams are realized. For the Fund: Build an Effective Early Stage Venture Network Mission
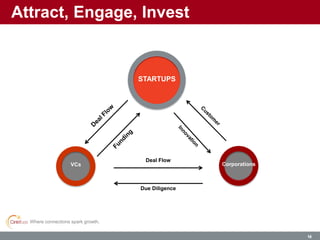
- 16. Where connections spark growth. 16 Attract, Engage, Invest 16 VCs Corporations STARTUPS Deal Flow Due Diligence
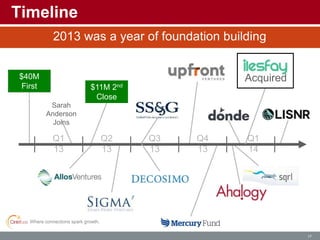
- 17. Where connections spark growth. 17 Timeline Q1 13 Q2 13 Q3 13 Q4 13 Q1 14 $40M First Close $11M 2nd Close Sarah Anderson Joins Acquired 2013 was a year of foundation building
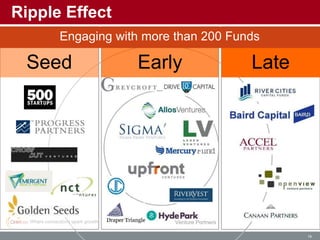
- 18. Where connections spark growth. 18 Ripple Effect Seed Early Late Engaging with more than 200 Funds
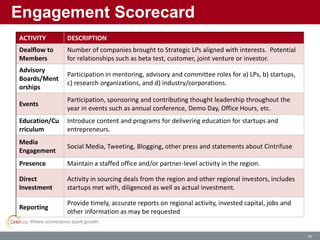
- 19. Where connections spark growth. 19 Engagement Scorecard ACTIVITY DESCRIPTION Dealflow to Members Number of companies brought to Strategic LPs aligned with interests. Potential for relationships such as beta test, customer, joint venture or investor. Advisory Boards/Ment orships Participation in mentoring, advisory and committee roles for a) LPs, b) startups, c) research organizations, and d) industry/corporations. Events Participation, sponsoring and contributing thought leadership throughout the year in events such as annual conference, Demo Day, Office Hours, etc. Education/Cu rriculum Introduce content and programs for delivering education for startups and entrepreneurs. Media Engagement Social Media, Tweeting, Blogging, other press and statements about Cintrifuse Presence Maintain a staffed office and/or partner-level activity in the region. Direct Investment Activity in sourcing deals from the region and other regional investors, includes startups met with, diligenced as well as actual investment. Reporting Provide timely, accurate reports on regional activity, invested capital, jobs and other information as may be requested
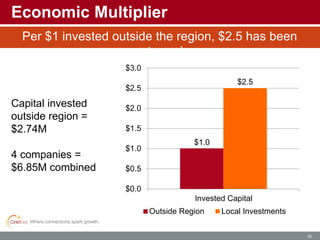
- 20. Where connections spark growth. $1.0 $2.5 $0.0 $0.5 $1.0 $1.5 $2.0 $2.5 $3.0 Invested Capital Outside Region Local Investments 20 Economic Multiplier Capital invested outside region = $2.74M 4 companies = $6.85M combined Per $1 invested outside the region, $2.5 has been returned
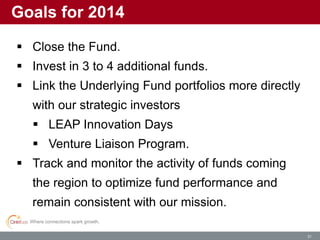
- 21. Where connections spark growth. 21 Goals for 2014  Close the Fund.  Invest in 3 to 4 additional funds.  Link the Underlying Fund portfolios more directly with our strategic investors  LEAP Innovation Days  Venture Liaison Program.  Track and monitor the activity of funds coming the region to optimize fund performance and remain consistent with our mission.
- 22. Where connections spark growth. 22 Questions
Editor's Notes
- #5: $9B invested in the VC asset class by LPs in Q1 2014…as compared to $17 to $20 (annual) in last few years. Most of which into a few larger funds $9.5B invested into companies, showing an increase again in Q1 for a $36B rate, up slightly from 2012 and 2013 VC Investment Exits in 2013 indicate great promise for the year ahead Over 1,800 Investor Exits in 2013, including 107 IPOs. Median Exit Size was $60M, up from $50.6M in 2012. IPO Exits doubled from 2013 to account for 15% of all VC Exits. Corporate Acquisitions and Notable IPOs Twitter: IPO in 2/2013, Market Cap at Year End of $18.10B (Internet). Zoetis: IPO in 11/2013, Market Cap at Year End of $15.38B (Pharmaceuticals).
- #6: Companies are raising capital earlier and are expected to have more substantial results before they get to later stage rounds Median Seed Stage Round Size rose 15% from $1.3M (2012) to $1.5M (2013). Median Pre-Money Valuation hit all-time high of $5.1M in 2013. Most Active VC Investors of 2013 - Incubators are among top-tier VC Investors. 500 Startups (150 Companies backed), Andreessen Horowitz (97), Google Ventures (81), Intel Capital (72), Y Combinator (71). VC Deals show growing importance of Angel/Series Stage Investing.
- #7: VCs invested $6.6 billion into 778 Life Sciences deals in 2013, compared to $6.7 billion in 800 deals in 2012. Decrease of 1% in dollars and 3% in deals.
- #10: Target is $60M – over 1/3 of this is confirmed. Working on nailing down the rest. Closing is planned for June 30
- #17: Our structure helps us de-risk and accelerate. Would be virtually impossible for a fund to do this on their own. B/c we chose to embed this in the non-profit, it is truly break through. But we need all parts to be successful.
- #19: Early in the development of Cintrifuse it was debated whether to invest the capital directly into Cincinnati-based companies, or rather into a network of venture firms. The Fund of Fund model is sowing signs that it works and is the right model to fuel activity. It is because it leverages: Capital Talent/Experience Networks Power Law of Participation Reduces Risks Leads to higher engagement.
- #21: Our first investment Latest Round TOTAL Ahalogy Hyde Park $3.10 $4.80 LISNR Progress, Jump $2.20 $3.10 Donde Mercury, Chicago $1.00 $1.20 SQRL Hyde Park $0.55 $0.55 $6.85 $9.65 Total Capital Called $4.60 $4.601.52.10 Capital Deployed (less mgt fee) $3.85 $3.851.82.5 Capital Deployed Outside Region2.742.74 2.5 3.5
- #22: Our first investment Latest Round TOTAL Ahalogy Hyde Park $3.10 $4.80 LISNR Progress, Jump $2.20 $3.10 Donde Mercury, Chicago $1.00 $1.20 SQRL Hyde Park $0.55 $0.55 $6.85 $9.65 Total Capital Called $4.60 $4.601.52.10 Capital Deployed (less mgt fee) $3.85 $3.851.82.5 Capital Deployed Outside Region2.742.74 2.5 3.5
- #28: Address the culture point